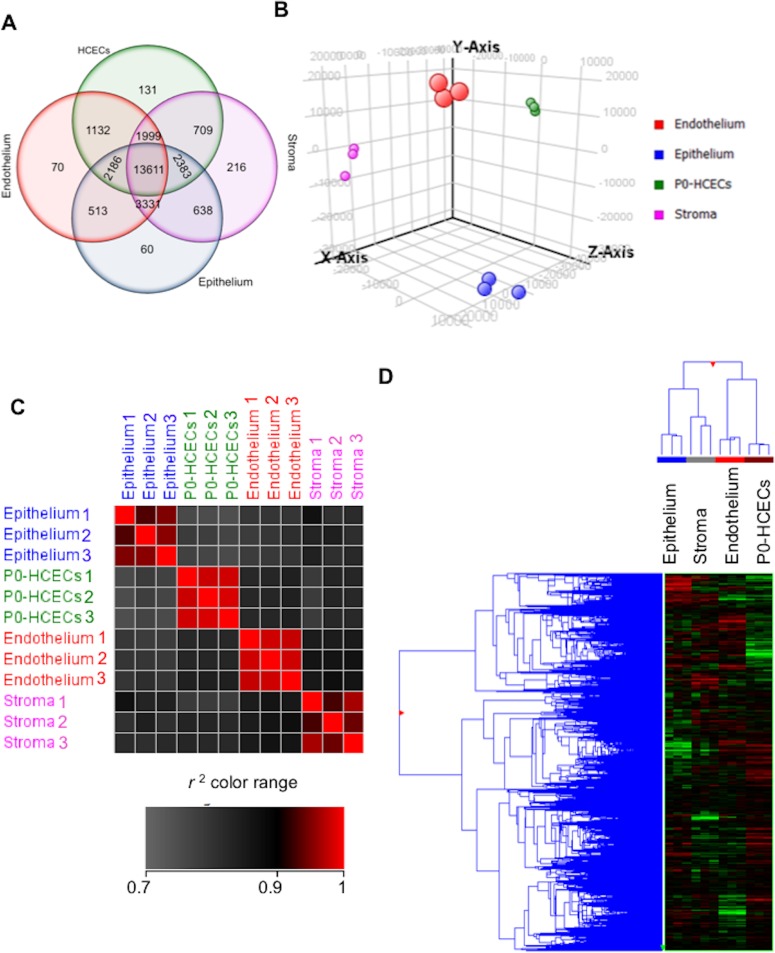
Figure 3.
Transcriptome analysis of corneal layers and cultured HCECs. (A) Venn diagram representing the probes expressed in the microarray dataset in the three corneal layers and freshly cultured HCECs. (B) Principal component analysis revealed distinct clusters per sample type as labeled; biological replicates (dots with the same color) clustered together. (C) Pearson correlation (r2) was higher within biological replicates than across different tissues (N = 3). (D) Hierarchical clustering demonstrated that HCECs and endothelium were more closely related than epithelium and stroma.

