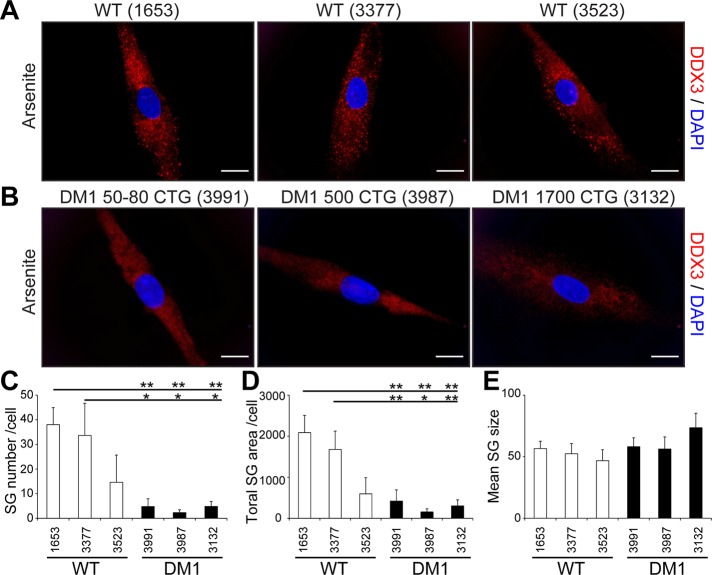
FIGURE 6:
Impaired SG formation in DM1 myoblasts. Control (A) and DM1 (B) human primary fibroblasts were converted into myoblasts by MyoD-lentivirus infections. Three days after infections, myoblasts were treated with 0.5 mM arsenite for 45 min. Immunofluorescence was performed with DDX3 antibodies to visualize SGs. DAPI was used to stain nuclei. The same exposure conditions were used to ensure quantitative analyses. Scale bars, 20 μm. (C) Mean number of SGs per cell, (D) total SG area (in pixels) per cell, and (E) mean SG size (pixels) per cell. From 134 to 179 random cells/condition were analyzed in three independent experiments. ANOVA was performed, and asterisks indicate significance (*p ≤ 0.05 and **p ≤ 0.01).

