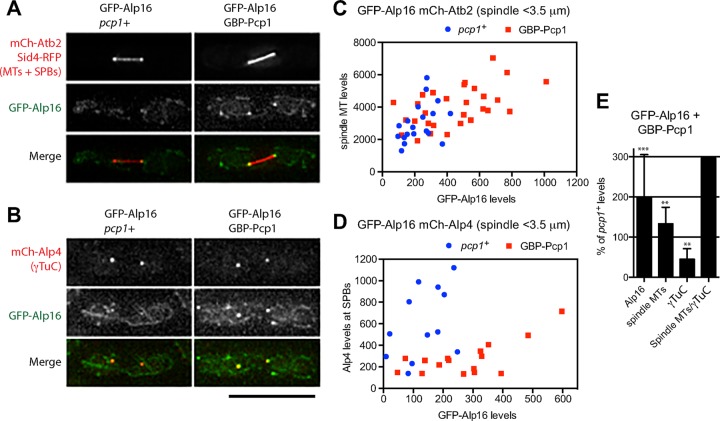
FIGURE 4:
Artificial targeting of Alp16GCP6 to Pcp1 increases ratio of spindle microtubules to γTuC levels. (A) Targeting of GFP-Alp16GCP6 to GBP-Pcp1 in cells expressing mCh-Atb2 increases spindle microtubule levels. Spindles observed in GFP-Alp16GCP6 and GFP-Alp16GCP6 GBP-Pcp1 cells expressing mCh-Atb2 and Sid4-mRFP. (B) Targeting of GFP-Alp16GCP6 to GBP-Pcp1 in cells expressing mCh-Alp4GCP2 reduces γTuC levels at mitotic SPBs. Spindles observed in GFP-Alp16GCP6 and GFP-Alp16GCP6 GBP-Pcp1 cells expressing mCh-Alp4GCP2. Scale bar, 10 μm. (C) Quantification of spindle microtubule levels at mitotic SPBs in cells with or without Alp16GCP6 targeting to Pcp1. GFP-Alp16GCP6 and mCh-Atb2 levels for spindles <3.5 μm in length were quantified. The sum of GFP-Alp16 levels at two SPBs of mitotic spindles is plotted against mCh-Atb2 levels. (D) Quantification of γTuC levels at mitotic SPBs in cells with or without Alp16GCP6 targeting to Pcp1. GFP-Alp16GCP6 and mCh-Alp4GCP2 levels for spindles <3.5 μm in length were quantified. (E) Levels of Alp16GCP6, spindle microtubules, and γTuC, and the ratio of spindle MTs to γTuC levels in GFP-Alp16GCP6 GBP-Pcp1 cells were compared with those in GFP-Alp16GCP6 pcp1+ cells. The p value is from unpaired t test: ***p = 0.0003 for Alp16GCP6 (N = 19 for pcp1+ and 29 for GBP-Pcp1 cells), **p = 0.0075 for spindle microtubules (N = 19 for pcp1+ and 29 for GBP-Pcp1 cells), and **p = 0.0017 for γTuC (N = 12 for pcp1+ and 16 for GBP-Pcp1 cells).

