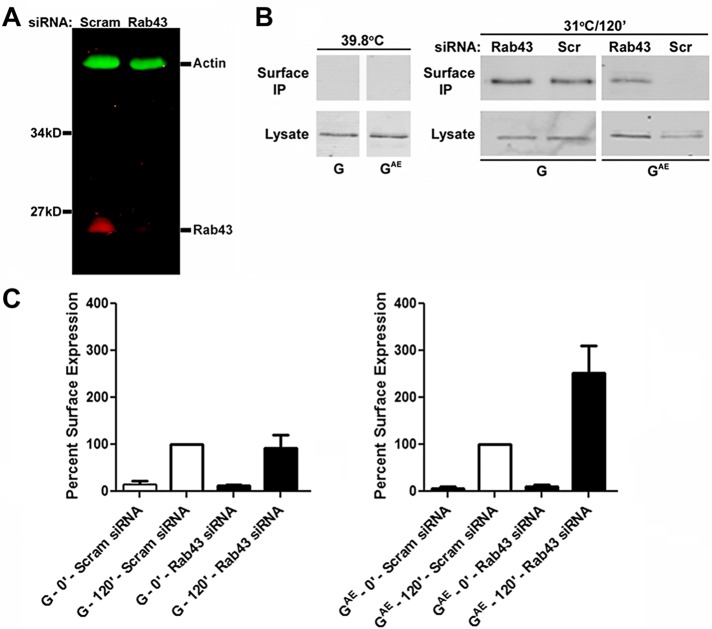
FIGURE 9:
Effect of Rab43 knockdown on GAE and G trafficking. (A) PH5CH8 cells were transfected with Rab43-specific SMART pool siRNAs (12.5 nM each) or with 50 nM scrambled control siRNA, and 4 d posttransfection, the cells were harvested. Lysates were analyzed by immunoblotting analysis with Rab43-specific rabbit polyclonal antibodies and actin monoclonal antibodies. (B) PH5CH8 cells transfected with the Rab43-specific SMART pool siRNAs or with the scrambled control siRNA were infected with adenovirus encoding GAE-EGFP or G-EGFP at 72 h posttransfection. After growth overnight at restrictive temperature, the cells were shifted to permissive temperature for 2 h. The cells were then shifted to 4°C and incubated with the I1 monoclonal antibody. After washing, cells were detergent lysed, and immune complexes were precipitated. The surface immunoprecipitate and lysate from each condition were analyzed by immunoblotting analysis with anti-VSV antibodies. Control experiments in which nontransfected cells were maintained at the restrictive temperature of 39.8°C are also shown. (C) PH5CH8 cells transfected with the Rab43-specific SMART pool siRNAs or with the scrambled control siRNA were infected with adenovirus encoding GAE-EGFP or G-EGFP at 72 h posttransfection. After growth overnight at restrictive temperature, the cells were shifted to permissive temperature for 0 or 2 h and fixed. Surface levels of GAE and G in nonpermeabilized cells were monitored by staining with the I1 monoclonal antibody, and surface-bound antibodies were detected using donkey anti-mouse immunoglobulin G conjugated to Alexa Fluor 594. The cells were imaged on a Zeiss AxioImager.M2 microscope, and the levels of surface GAE and G were quantified. The values presented represent the surface fluorescence normalized to total G and GAE levels at each time point.

