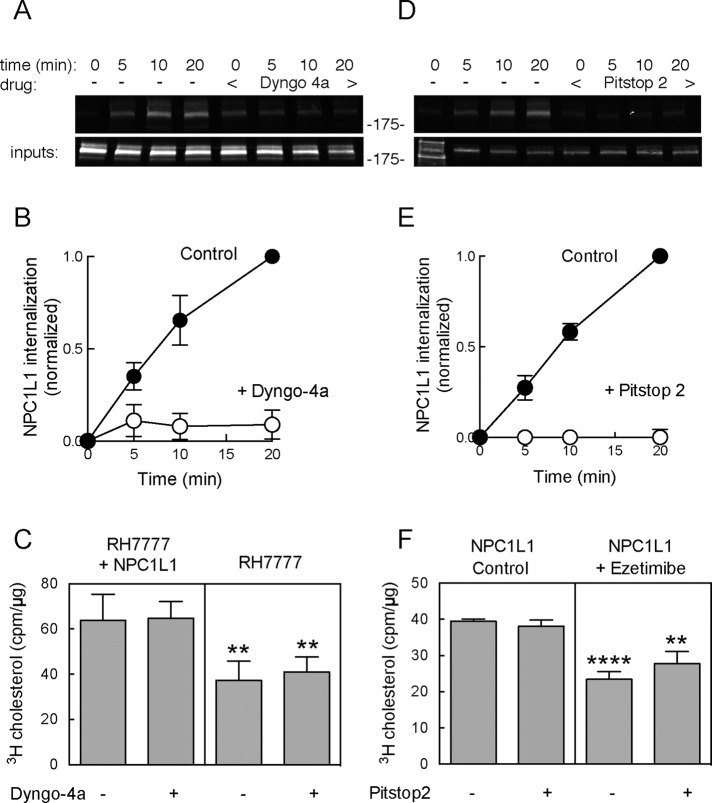
FIGURE 7:
Dyngo-4a and Pitstop 2 block NPC1L1 endocytosis but not cholesterol uptake. (A) Immunoblot (anti-GFP) showing endocytosis of NPC1L1-WT-GFP (as described in Figure 2) ± 30 min pretreatment with 20 μM Dyngo-4a. (B) Graph of NPC1L1 endocytosis measured in the absence (open circles) or presence (filled circles) of 20 μM Dyngo-4a. Values represent means of duplicates from a representative experiment. (C) The [3H]cholesterol uptake (20 min) from sodium taurocholate micelles ± Dyngo-4a; 18.5 μg of each sample was counted. Values represent the mean of quadruplicates from a representative experiment. The p values for pair comparisons ± NPC1L1 are 0.0096 and 0.003 (t test). (D) Immunoblot (anti-GFP) showing endocytosis (as described in Figure 2) of NPC1L1-WT-GFP ± 10 min pretreatment with 25 μM PitStop 2. Values represent means of duplicates from a representative experiment. (E) NPC1L1 endocytosis measured in the absence (open circles) or presence (filled circles) of 25 μM Pitstop 2. (F) The [3H]cholesterol uptake (20 min) from sodium taurocholate micelles ± ezetimibe and/or Pitstop 2 as indicated; 29 μg of each sample was counted. Values represent the mean of quadruplicates from a representative experiment. Error bars represent SEM. The p values for pairwise comparisons ± ezetimibe are ****p < 0.0001 and **p < 0.0027 (unpaired t test).

