. 2016 Mar 25;5:e10288. doi: 10.7554/eLife.10288

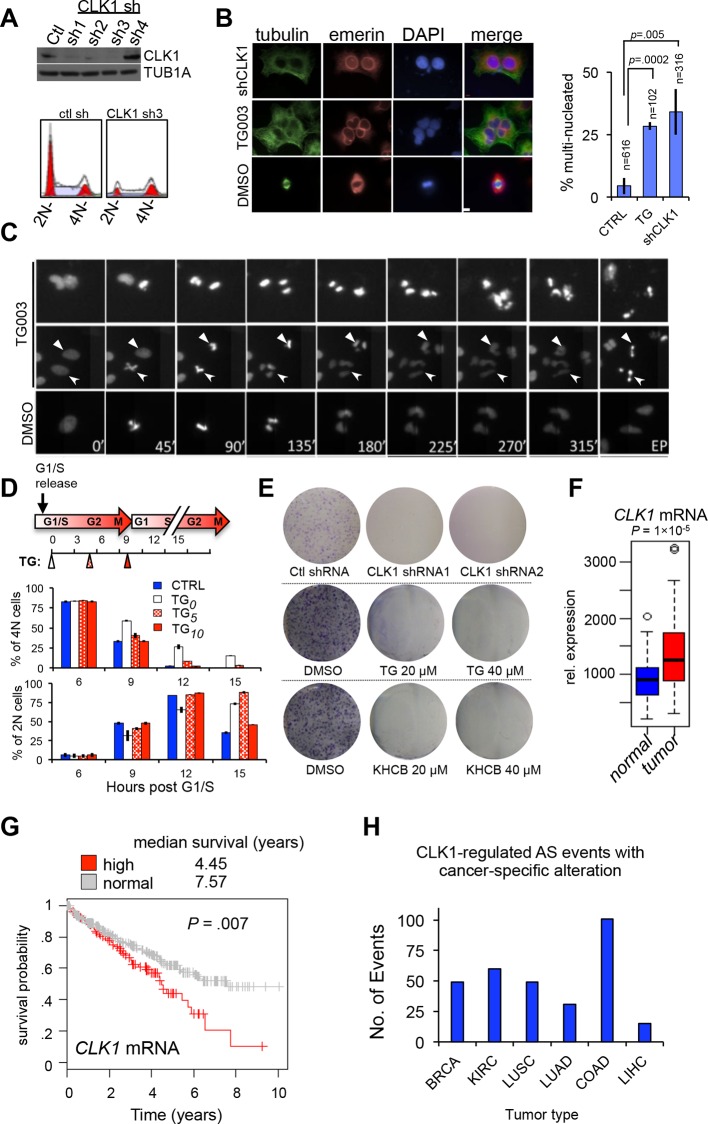
Figure 4. CLK1 is required for cell cycle progression and proliferation.

(A) Immunoblot analysis of CLK1 proteins after stable shRNA knockdown in HeLa cells. Bottom, DNA content as measured by propidium iodide staining following flow cytometry. (B) Immunofluorescence microscopy of A549 cells depleted of CLK1 by shRNA (top row), cells treated with 10 µM TG003 for 12 hr (middle row), and a control treatment with DMSO (bottom row); green: tubulin, red: emerin (nuclear envelope), and blue: DAPI. Scale bar 10 µm. Right bar graph shows the quantification of multinucleated cells. p values determined using Student’s t-test. (C) Static frames from a live-cell high-content imaging movie of HeLa cells expressing Histone H2B-GFP and treated with TG003 (top panel). Time after start of the experiment is indicated; EP, end point (~960 min). TG003 treated cells with apparent cell division defects (indicated by arrowheads in the bottom field) are shown in two independent fields. (D) Synchronized HeLa cells were treated with 20 µM TG003 at the indicated time points (0, 5, and 10 hr) and analyzed by propidium iodide staining and flow cytometry to measure DNA content. Percent of 2N (lower bar graph) and 4N (upper bar graph) cells were quantified at each time point as indicated in the treatment scheme (top). (E) Colony formation assay of HeLa cells depleted of CLK1 by shRNA, or continuously treated with TG003 or KHCB-19 at the indicated concentrations. (F) Box plot representation of CLK1 mRNA expression levels in paired normal and tumorous kidney tissue. 72 cases were analyzed. (G) Kaplan-Meier plot showing survival differences between patients with kidney tumors with high CLK1 (red, upper quartile) or reduced CLK1 (blue, lower three quartiles) expression. (H) Number of cancer-associated AS events that are also regulated by CLK1 in different tumor types. BRCA, Breast invasive carcinoma; COAD, Colorectal adenocarcinoma; KIRC, Kidney renal clear cell carcinoma; LUAD, Lung adenocarcinoma; LUSC, Lung squamous cell carcinoma; LIHC, liver hepatocellular carcinoma.

DOI: http://dx.doi.org/10.7554/eLife.10288.010

Figure 4.

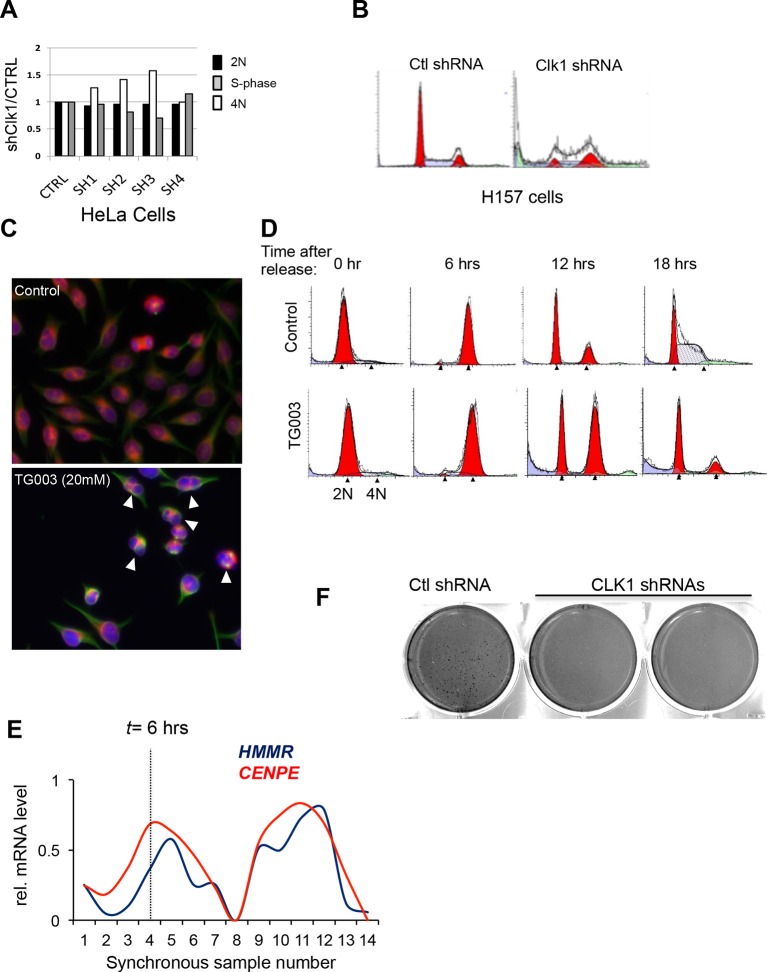
Figure 4—figure supplement 1. Loss of CLK1 results in cell cycle defects in multiple cell types.

Figure 4—figure supplement 1.

(A) Cell cycle composition as measured by propidium iodide staining of DNA and flow cytometry analysis of cells that have been depleted of CLK1 by the indicated shRNAs. (B) Representative histograms of propidium iodide stained H157cells to determine cell cycle defect after RNAi of CLK1. (C) HeLa cells treated with TG003 also have defective cell division. Immunofluorescence microscopy was used to detect multi-nucleated cells, and a representative field is shown (green:tubulin, red:emerin, blue:DAPI). (D) Representative histograms of DNA content in synchronous HeLa cells treated with TG003. The time after early S phase release (when TG003 was added) is indicated, These data are associated with Figure 4 of the main text. (E) Representative image from anchorage-independent growth assays (soft agar assay) of HeLa cells after depletion of CLK1. (F) Relative mRNA expression levels of CENPE and HMMR during cell cycle. Data obtained from RNA-Seq analysis. Dashed line represents 6 hr after release from G1/S.
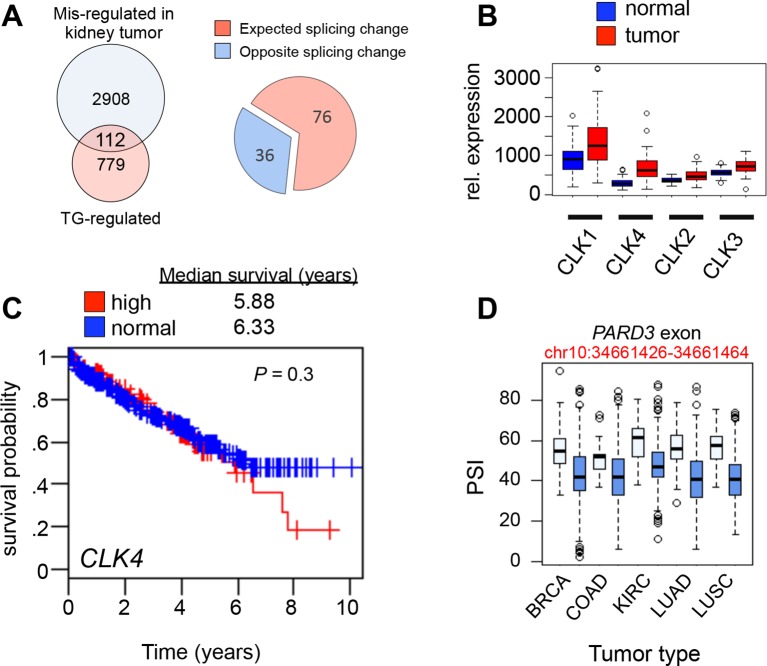
Figure 4—figure supplement 2. CLK1 mis-regulation in human cancer.

Figure 4—figure supplement 2.

(A) Overlap of AS events that were altered in kidney cancers (as compared to normal kidney samples) and AS that was altered in asynchronous cells treated with TG003 (left panel). Pie chart denoting if AS in cancer occurred in the expected direction, that is, normal kidney resembled TG003 treatment while tumor kidney resembled untreated cells (see methods). (B) Boxplot representation of CLK1, CLK2, CLK3 and CLK4 mRNA levels in 72 paired normal vs. cancer kidney cancer (cRCC) samples. Kolmogorov-Smirnov test significance for each factors is as follows CLK1: p=3 × 10⁻⁵, CLK2: p=1.2 × 10⁻⁷, CLK3: p=2.8 × 10⁻¹², CLK4: p=2.2 × 10⁻¹⁶. (C) Kaplan-Meier plot of kidney (cRCC) patients with tumors expressing high CLK4 (red, upper quartile) vs. normal CLK4 (blue, 1–3 quartile). (D) PARD3 exon (chr10:34661426–34661464) PSI levels in five cancer cases are shown as an example of TG003-sensitive AS which is altered between normal and cancer tissues.