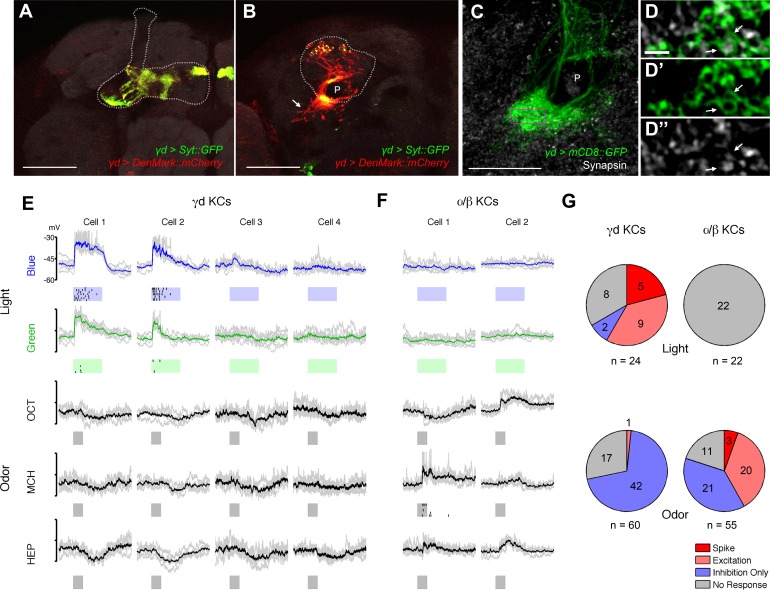
Figure 2. γd neurons are atypical KCs and respond to visual stimuli.
(A–B) Main output and input sites labeled by Syt::GFP (green) and DenMark::mCherry (red) are differentially localized to the dorsal γ lobe and the vAC (arrow). The MB lobe (A) and main calyx (B) are outlined. P: MB peduncle (C–D) The γd dendrites (green) enwrap presynaptic terminals (gray; arrows). A single optical slice of the inset in the projection in C is magnified in D-D’’. P: MB peduncle. Scale bars: 50 µm (A–B); 20 µm (C); 2 µm (D-D’’). (E) Responses to light and odor stimulation in γd KCs measured with whole-cell current-clamp recordings. Data from four representative neurons are shown (each column corresponds to the data from one cell). Voltage traces of individual trials (gray lines, 5–7 trials) are overlaid with the mean (colored line). Raster plots below the traces represent spikes. Stimulus presentation is indicated below each trace (duration = 1 s). For odors, three of five tested odors are displayed (OCT: 3-octanol; MCH: 4-methylcyclohexanol; HEP: 2-heptanone). (F) Responses in two representative α/β KCs. (G) Modality segregation by γd (n = 12 cells) and α/β KCs (n = 11 cells). Each of the pie charts represents 24 (γd) or 22 (α/β) light-cell pairs measured in 6 flies and 60 (γd) or 55 (α/β) odor-cell pairs measured in 3 flies. The distributions of all four response categories are significantly different between γd KCs and α/β KCs with respect to both visual (p<10–5, Fisher’s exact test) and odor responses (p<10–6) See Materials and methods for details.

