
Figure 4. Methylation of Gli3 positively regulated the A549 proliferation and migration ability.
(A and B) Shh luciferase reporter assay (A) and qPCR (B) of Gli1, Ptch1 and Set7 in A549 cells in the condition of Set7 knockdown. (C) Western of flagged Gli3WT, Gli3K436R, Gli3K595R or Gli3KRKR in A549 stable cells used in (D-M). (D and E) qPCR (D) of Gli1 and Ptch1 and Shh luciferase reporter assay (E) in A549 cells expressing Gli3WT, Gli3K436R, Gli3K595R or Gli3KRKR. (F) MTT assays in A549 cells expressing indicated proteins. (G and G’) Photography (G) and statistic results (G’) of anchorage-independent growth assay in A549 cells expressing indicated proteins. (H and I) Statistic (H) and photography (I) results of tumor size in A549 cells expressing indicated proteins. (J) Tumor growth curves of A549 cells express indicated protein in a xenograft mouse model. (K–M) Migration ability evaluated by wound healing assay (K) and transwell migration assay (L). Invasiveness evaluated by matrigel invasion assay (M) in A549 cells expressing indicated proteins. All the qPCR results are normalized to GAPDH. Data in (D–H, J) were represented as mean ± SEM (n=3). *p<0.05, **p<0.01, ***p<0.001 versus Gli3WT. Ctrl, Control.

Figure 4—figure supplement 1. The involvement of this Set7-Gli3-Gli1 axis in the development of NSCLCs.
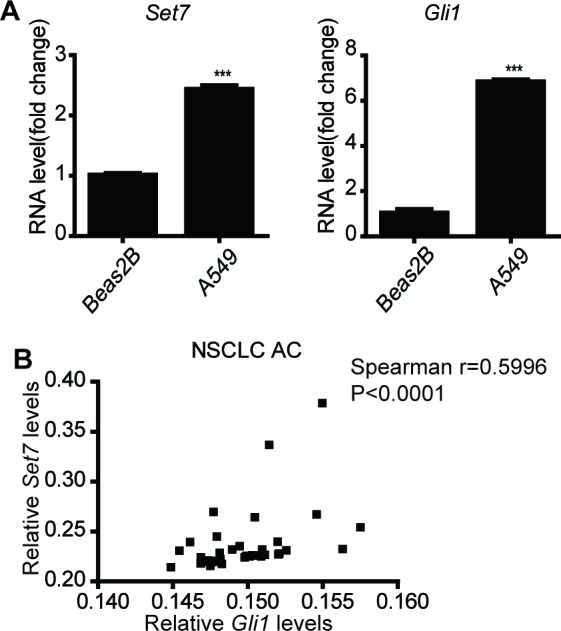
Figure 4—figure supplement 2. Methylation on the Gli3PA promoted the A549 tumorigenesis.
