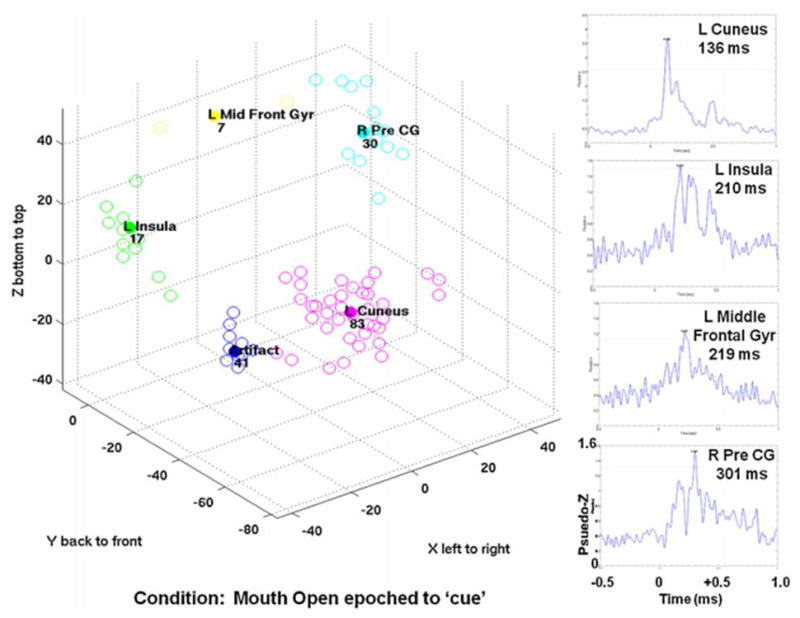
Figure 1.

Results from mouth open, time-locked to stimulus onset (‘cue’) condition. Three-dimensional plot of the cluster analysis results are on the bottom left. All clusters are labelled. On the right, time-course virtual sensors were re-constructed at the cluster centroid location and peaks with significant magnitude were identified. Each of these virtual sensors is shown with the significant peak labelled.
