Figure 2.

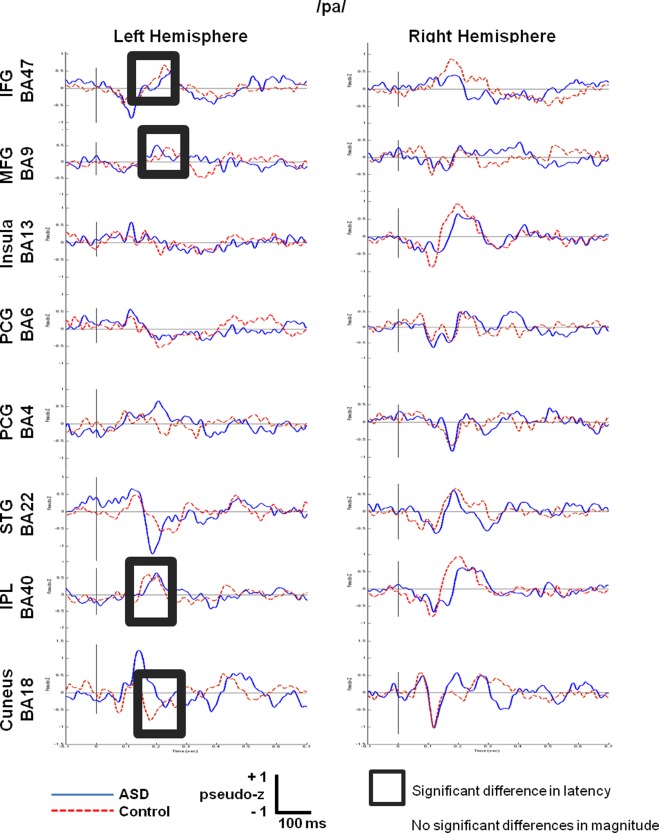
Grand‐averaged time courses of activation (‘virtual sensors’) reconstructed from 8 regions of interest in the left hemisphere and their homologous right hemisphere locations for the/pa/condition.

Grand‐averaged time courses of activation (‘virtual sensors’) reconstructed from 8 regions of interest in the left hemisphere and their homologous right hemisphere locations for the/pa/condition.