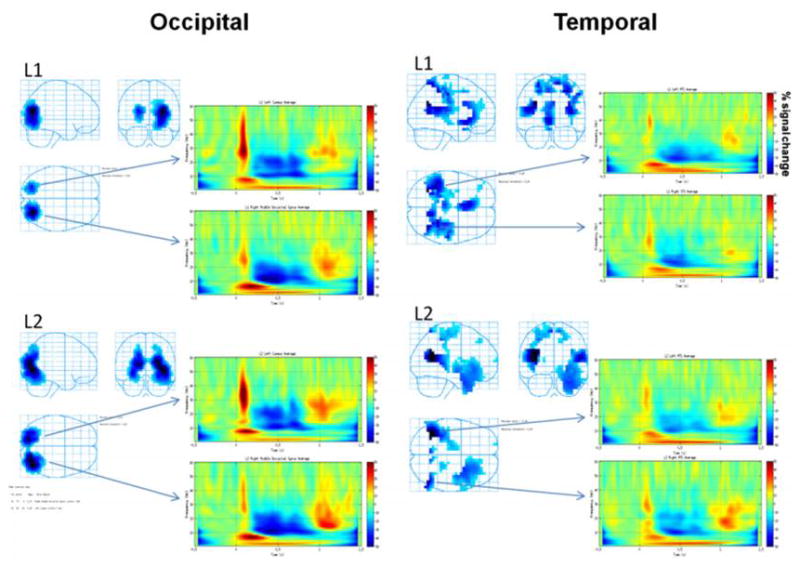
Figure 1. Event-related desynchrony (ERD) in occipital (left panel) and temporal (right panel) regions for L1 and L2.

Occipital ERD (left panel): Glass brains show occipital locations for ERD with L1 and L2 use. Time-frequency plots at these locations show similar patterns of percent change in ERD for L1 and L2 at left cuneus and right middle occipital gyrus. Temporal ERD (right panel): Glass brains show temporal locations for ERD with L1 and L2 use. Time-frequency plots at these locations show similar patterns of percent change in ERD for L1 and L2 at middle and superior temporal gyri.
