
Figure 2. Thresholded event-related desynchrony localizations in the 5-15 Hz bandpass.
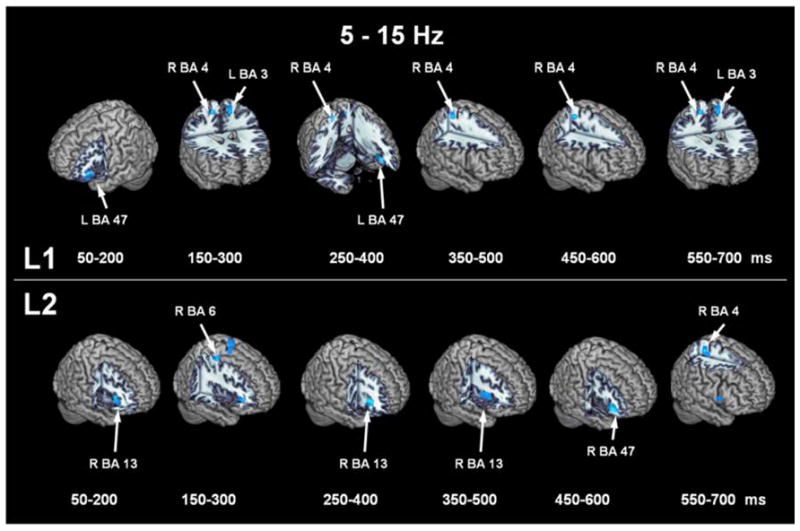
ERD locations for L1 (top row) and L2 (bottom) row for each time window in the 5-15 Hz bandpass.
Official websites use .gov
A
.gov website belongs to an official
government organization in the United States.
Secure .gov websites use HTTPS
A lock (
) or https:// means you've safely
connected to the .gov website. Share sensitive
information only on official, secure websites.
ERD locations for L1 (top row) and L2 (bottom) row for each time window in the 5-15 Hz bandpass.