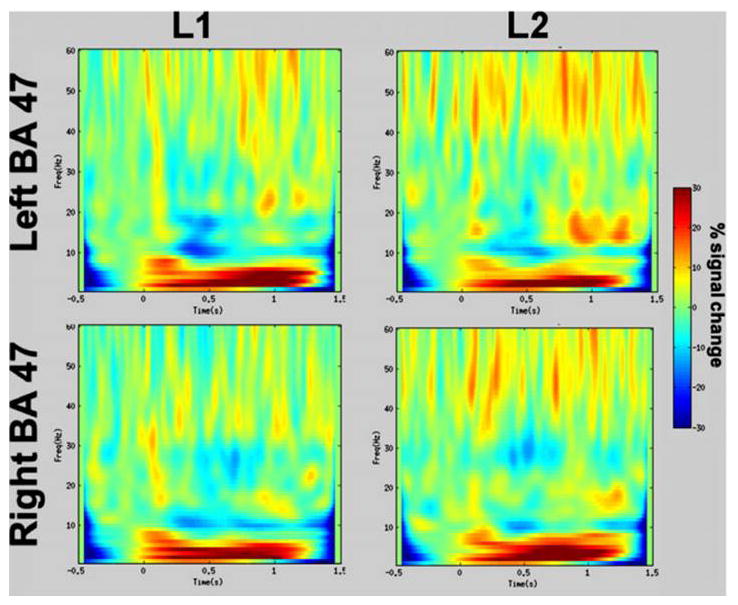
Figure 3. Time-frequency plot at inferior frontal locations.

Time- frequency plots demonstrate percent change in ERD in left BA 47 and homologous right BA 47 for L1 and L2. The L1 ERD is more left lateralized while the L2 ERD is more bilateral.

Time- frequency plots demonstrate percent change in ERD in left BA 47 and homologous right BA 47 for L1 and L2. The L1 ERD is more left lateralized while the L2 ERD is more bilateral.