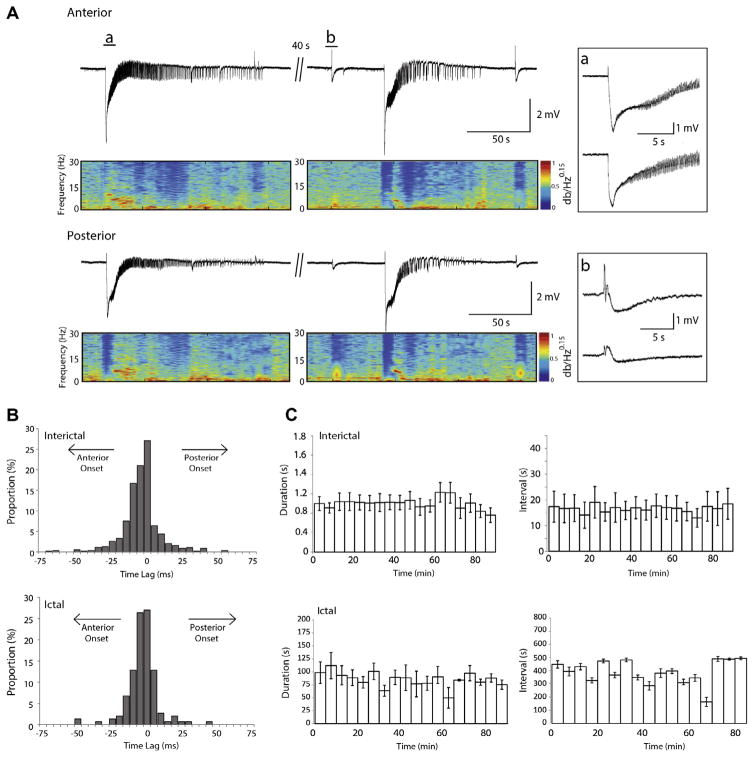
Fig. 1.
Interictal and ictal discharges in the piriform cortex. (A) Epileptiform discharges recorded from the anterior and posterior piriform cortices of an intact brain slice following the application of 4AP. The spectrograms show the initial negative shift followed by oscillations in the 10–20 Hz range characterizing the ictal event. The ictal onset and an interictal discharge are expanded in insets a and b, respectively. (B) Time delay histograms between the anterior and posterior regions calculated for interictal and ictal discharges. These are pooled data from 19 slices. Note the jittering in the region of onset, as no event initiated in one region in particular. Events in the anterior piriform cortex are used as the reference (time 0). (C) Epileptiform activity does not change over time during 4AP application (n=5 slices). Upper panels show the duration and interval of occurrence of interictal events over time, respectively while lower panels show the duration and interval of occurrence of ictal events; data were averaged in epoques lasting 5 min. Time 0 represents the time of appearance of spontaneous epileptiform activity.

