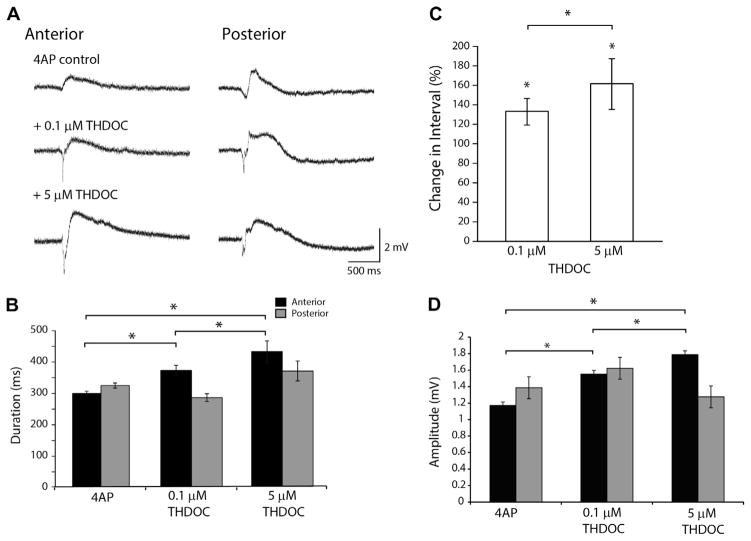
Fig. 2.
Modulation of Interictal discharges by THDOC. (A) Representative examples of interictal events in the 4AP control, 4AP+0.1 μM THDOC and the 4AP +5 μM THDOC condition. (B) Bar graph showing the average duration of 4AP-induced slow events. THDOC induced a significant increase in duration of these slow events in the anterior region. (C) Bar graph showing the change in interval of interictal events normalized to the 4AP control condition (100%). THDOC induced a significant increase compared to 4AP. (D) Change in amplitude of interictal events, note that THDOC induced a significant increase of amplitude compared to 4AP. (*p<0.05; 4AP pooled data from n=13 slices, 0.1 μM THDOC n=7 slices, 5 μM THDOC n=7 slices).

