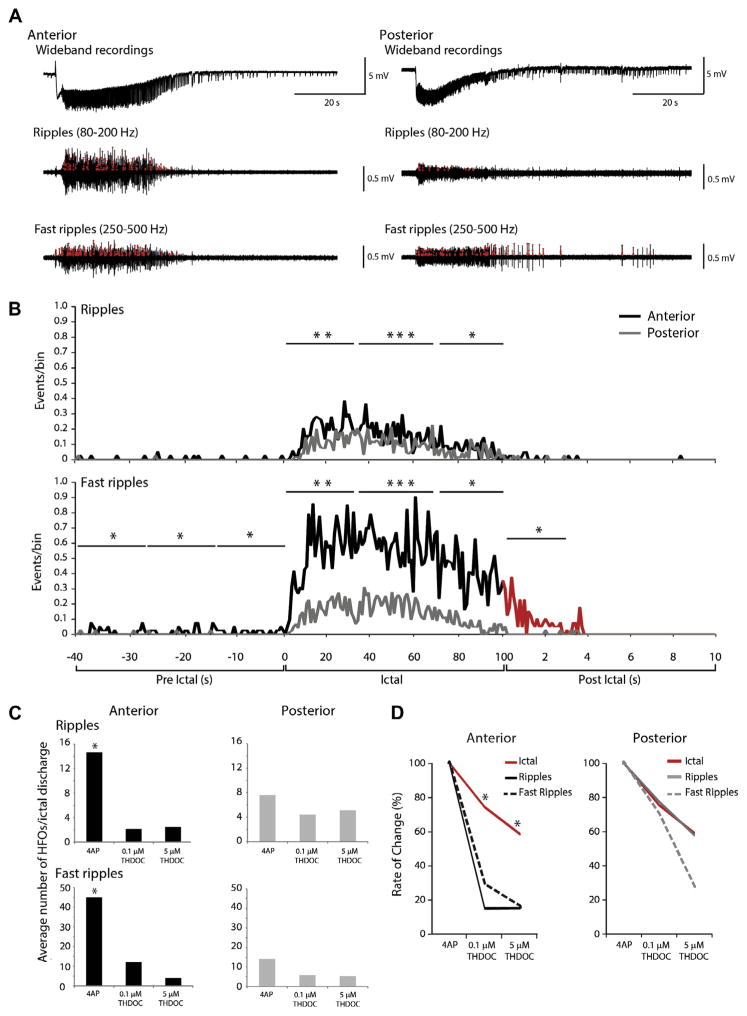
Fig. 5.
HFOs during ictal discharges. (A) Representative 4AP-induced ictal discharge from the anterior and posterior piriform cortex, with filtered traces showing HFOs (red circles) in the ripple and fast ripple frequency ranges. (B) Rates of ripples and fast ripples over time during 4AP induced ictal discharges in the anterior and posterior regions (data pooled from n=19 slices). Note that ripples and fast ripple rates are significantly higher in the anterior compared to the posterior region. During the pre- and post-ictal periods, rates of fast ripples are also significantly higher in the anterior region of the piriform cortex compared to the posterior region. (C) Bar graphs showing the average number of HFOs per ictal discharge following the application of 4AP (n=13), 0.1 μM (n=7 slices) and 5 μM THDOC (n=6 slices). Application of THDOC induced a significant decrease in the occurrence of HFOs in the anterior region, but not in the posterior region. (D) Line graph showing the change in ictal duration compared to the change in HFO rate following the application of either 0.1 or 5 μM THDOC. All events are normalized to the 4AP control condition. (*p<0.05, **p<0.01, ***p<0.001). (For interpretation of the references to color in this figure legend, the reader is referred to the web version of this article.)

