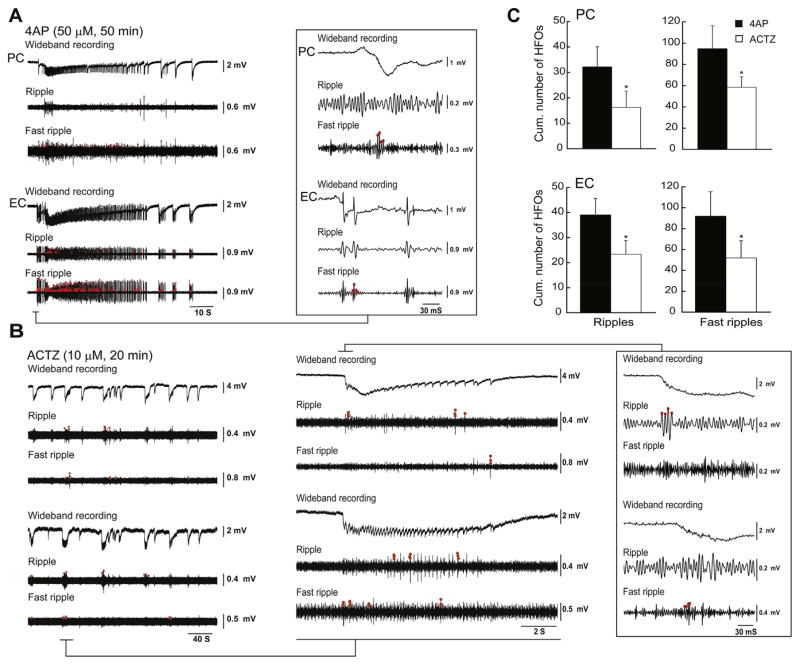
Fig. 6.
A: Under control conditions both ripples and fast ripples occur during an ictal discharge recorded from the PC and EC under control (4AP, 50 μM) conditions (n = 10 experiments). Ripples and fast ripples are indicated by the red dots. B: Both types of HFOs decrease in rate during application of ACTZ (10 μM) as also shown in the enlarged portion of the recordings in the inset. C: Bar graphs showing the cumulative number of ripples and fast ripples associated with ictal discharges during control 4AP (50 μM) and application of ACTZ (10 μM) in PC and EC. *p < 0.05. (For interpretation of the references to color in this figure legend, the reader is referred to the web version of this article.)

