Figure 7.
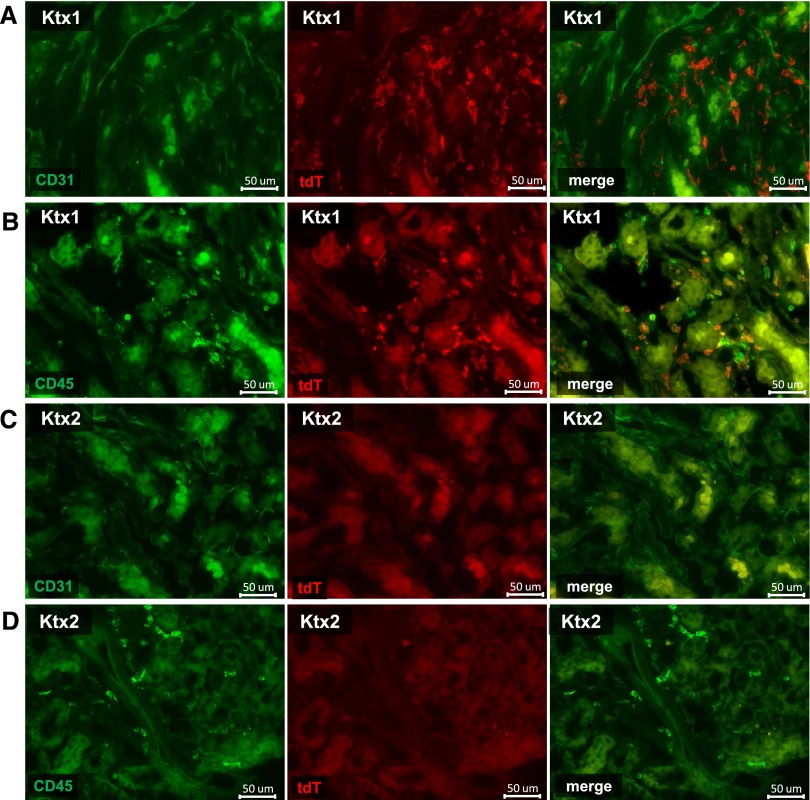
Histology following experimental kidney transplantation in mice. Co-staining of tdT+ cells (red) with CD31 (green; A, day 2) and CD45 (green; B, day 2) using the Alexa flour 488 dye on formalin-fixed frozen sections. Figure 7C depicts the absence of tdT+/CD31+ EC following combined BMTx with KTx and Figure 7D depicts the BM origin if invading CD45+ extrarenal by their tdT negativity. Virtually no other extrarenal cells can be detected.

