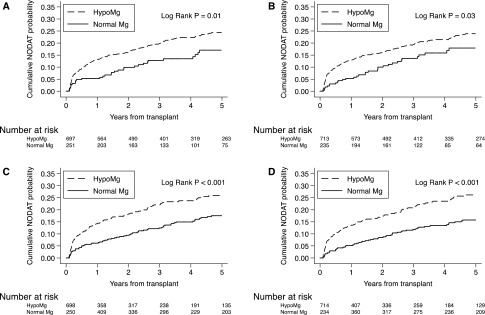
Figure 2.
Kaplan–Meier curves for NODAT using different approaches to analyze Mg levels post-transplant. Cumulative probabilities of NODAT by (A) serum Mg at 1-month post-transplant; (B) average serum Mg over the first month post-transplant; (C) time-varying serum Mg updated at 3-month intervals; and (D) rolling-average time-varying serum Mg assessed over 3-month exposure windows.

