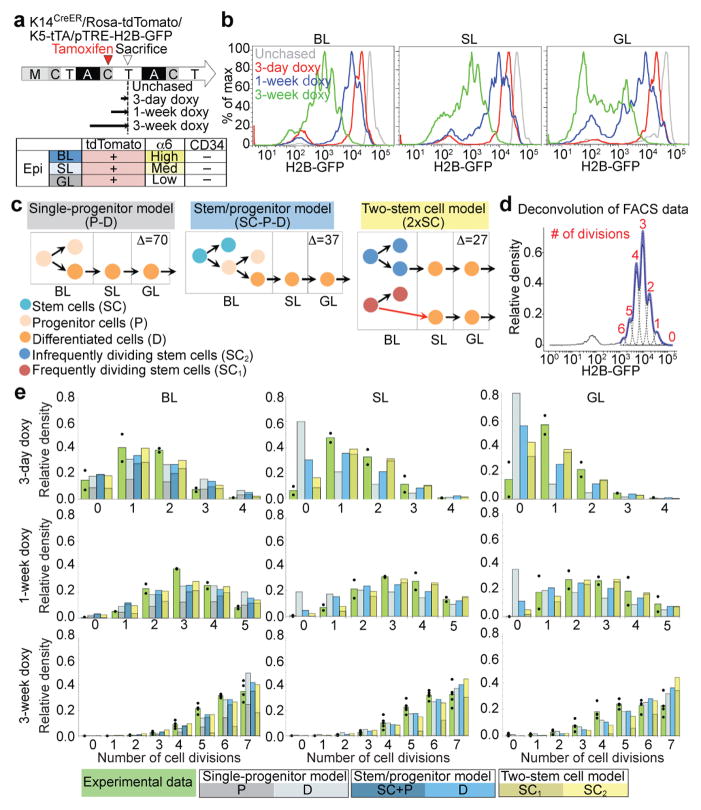
Figure 3. H2B-GFP dilution implies two independent cell populations with different proliferation and transport rates.
a, Doxy-chase scheme and epidermal compartment markers. b, FACS histograms showing H2B-GFP dilution patterns for different chases in basal layer (BL), spinous layer (SL) and granular layer (GL). c, Models. Δ assesses the best-fit; smaller is better. Red arrows denote division coupled to transport. d, Example of deconvolution of H2B-GFP fluorescence histogram and determination of cell division number (d)-distribution. e, Normalized compartment d-distributions after different chase periods. The data from individual mice are shown as dots with means given by the green bars. The other bars are the predictions from the indicated models using the best-fit parameters; they are subdivided to represent individual model component contributions (see Supplementary Note). The FACS experiments are repeated twice with 2 mice for day 3 and 7; twice with 5 mice for day 21 (b, d, e).

