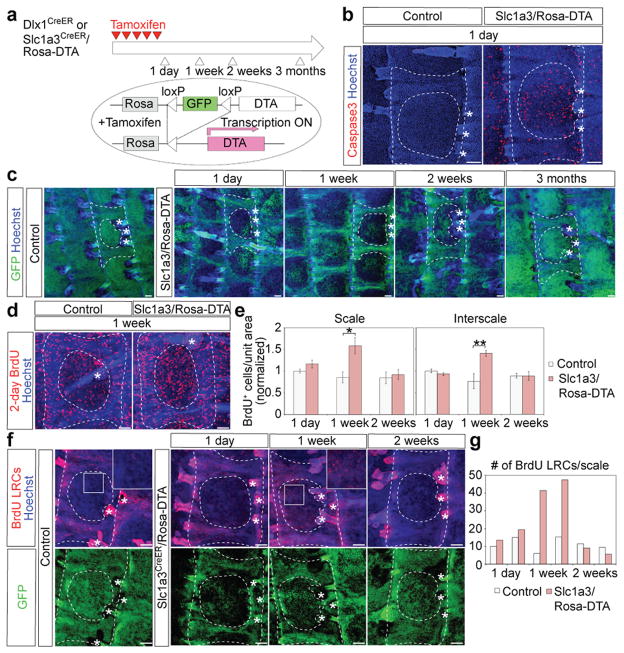
Figure 7. Dlx1CreER- and Slc1a3CreER-marked cells replenish each other’s territories following selective killing or injury.
a, Scheme to ablate Dlx1CrER+ or Slc1a3CreER+ cells using DTA induction via tamoxifen (TM) injection. b-d, Whole-mount immunostaining of the tail epidermis. (b) Note frequent Caspase3+ cells, a marker of apoptosis, within the scale area one day after the last TM injection in Slc1aCreER/Rosa-DTA (right) but not control (left) skin. (c) Note the striking loss of GFP (indicative of cell death) in scale regions relative to control in skin collected at 1 day, 1 week, and 2 weeks after the last TM injection, and the recovery of signal by 3 months post-TM. (d) Note the increased frequency of BrdU+ cells (indicative of proliferation) relative to control at 1-week post-TM. e, Quantification of BrdU+ cells per unit area at the indicated post-TM time points Error bars show s.e.m. (n = 3 mice).; **P<0.01; *P<0.05*. Statistical analyses were performed using the two-tailed Student’s t-test. (Scale 1 week, control vs Slc1a3CreER/DTA, P=0.02; interscale 1 week, control vs Slc1a3CreER/DTA, P=0.01.) f, Tail epidermis whole-mounts from mice subjected to BrdU pulse-chase, which marks the interscale area as BrdU-LRCs, followed by selective killing within the scale area induced by TM injection in Slc1a3CreER/Rosa-DTA mice. Insets are higher magnifications of the boxed area and illustrate massive migration of LRCs into the scale area by 1-week post-TM. g, Quantification of BrdU LRCs in scales in mice from (f) (data from each mouse shown as an individual bar). Dashed lines delineate boundaries of the tail epidermis structures. Asterisks indicate HFs. Scale bars, 100 μm (b, c, d, f). Experiments are repeated twice with 2 different mice for all representative images (b, c, d, f).

