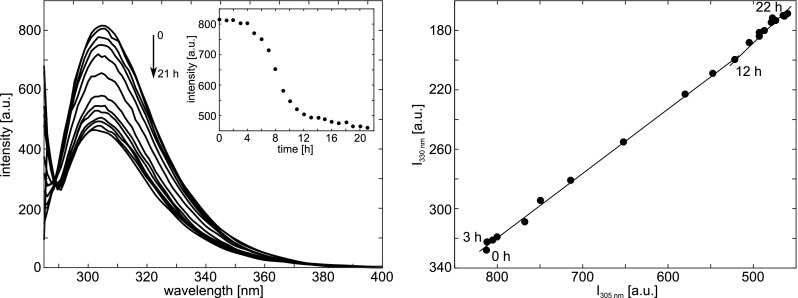
Fig. 11.

Left: Fluorescence emission spectra of Tyr during insulin aggregation initiated by incubation under conditions favoring fibrillation. Spectra registered at 1-h intervals are shown. The inset shows a sigmoidal change observed in the emission intensity at 305 nm as a function of time; Right: Phase diagram obtained from Tyr fluorescence data that reveal the existence of structural intermediates on thermal denaturation of insulin. Taken from Bekard and Dunstan (2009)
