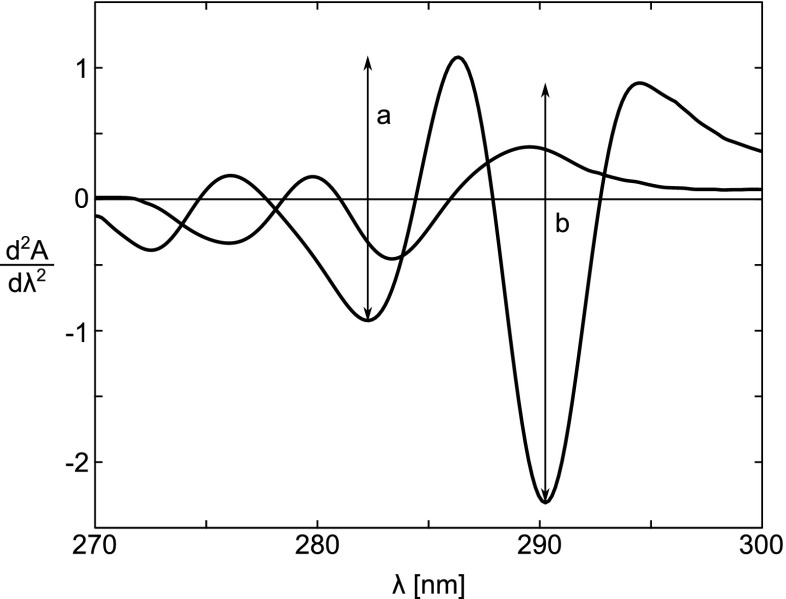
Fig. 2.
Second-derivative spectra of equimolar solutions of N-Ac-Trp-NH2 and N-Ac-Tyr-NH2 dissolved in 6.0 M Gdn ⋅HC–0.05 M phosphate, pH 6.5. The spectrum of N-Ac-Trp-NH2 is identified by the two arrowsa and b, which indicate the peak-to-peak distances between the maximum at 287 nm and the minimum at 283 nm, and the maximum at 295 nm and the minimum at 290.5 nm, respectively. Taken from Ragone et al. (1984)

