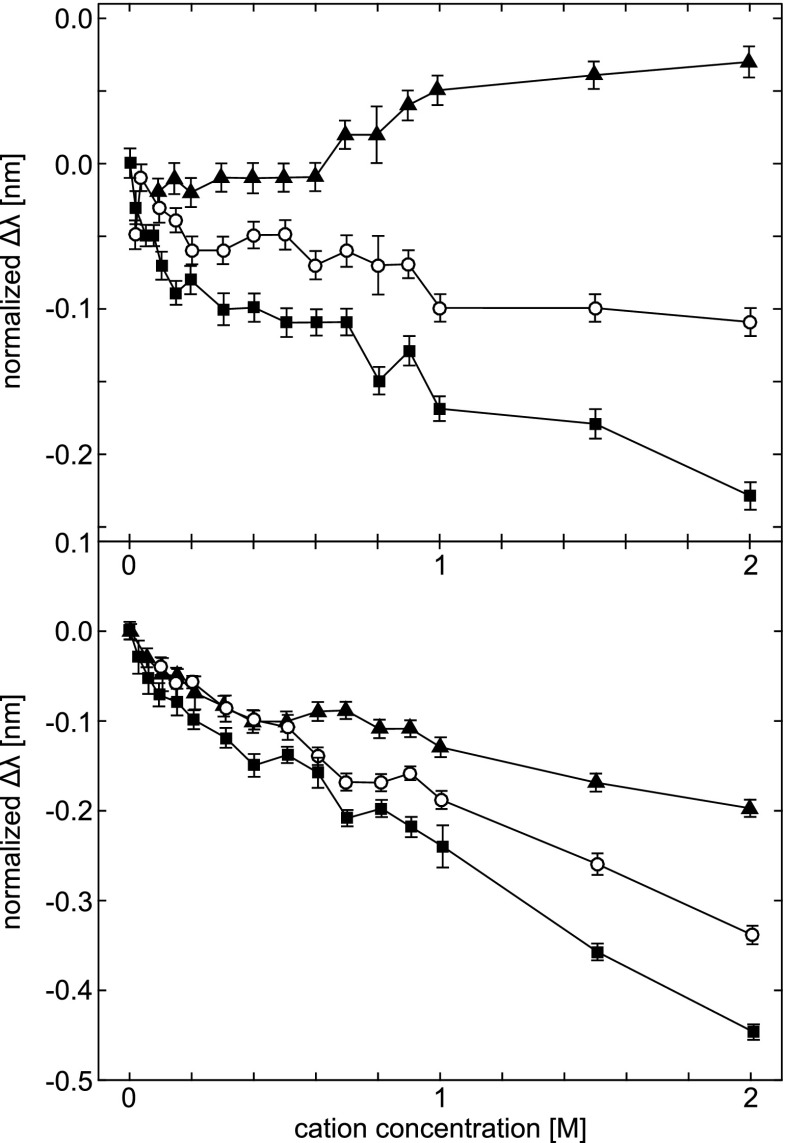
Fig. 6.
Tyr peak shifts in the second-derivative UV absorption spectra of Ribonuclease T1 (top) and human serum albumin (bottom), induced by the cations Li + (filled squares), Na + (open circles), and Cs + (filled triangles). The data are displayed as in Fig. 5, with initial peak positions of 277.61 ±0.01 nm for RNAse T1, and 278.82 ± 0.01 nm for HSA. Error bars represent the standard deviation of the mean for three experiments for each salt. Taken from Lucas et al. (2006)

