
Figure EV2. Increased replication fork stall and new origin firing in SirT7 −/− MEFs.
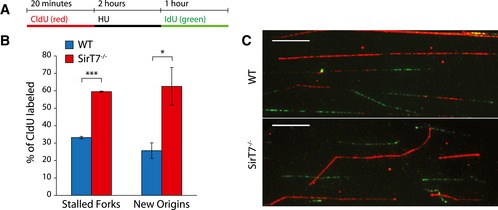
- Schematic representation of labeling protocol used in (B, C). Cells were pulse‐labeled with CldU (red) for 20 min, treated with 2 mM HU for 2 h, and released into media containing IdU (green) for 1 h.
- Quantitation of the experiment depicted in (A, C), using WT and SirT7 −/− primary MEFs in passage 3. Data represent the relative number of stalled forks (CIdU only, red), and new origins (IdU only, green) from the total number of replication tracks labeled with CldU (mean ± SEM; three samples per genotype). *P < 0.05; **P < 0.01; ***P < 0.001 by ANOVA single factor.
- Representative images from the experiment described in (A) and quantified in (B). Scale bar 10 μm.