-
A–E
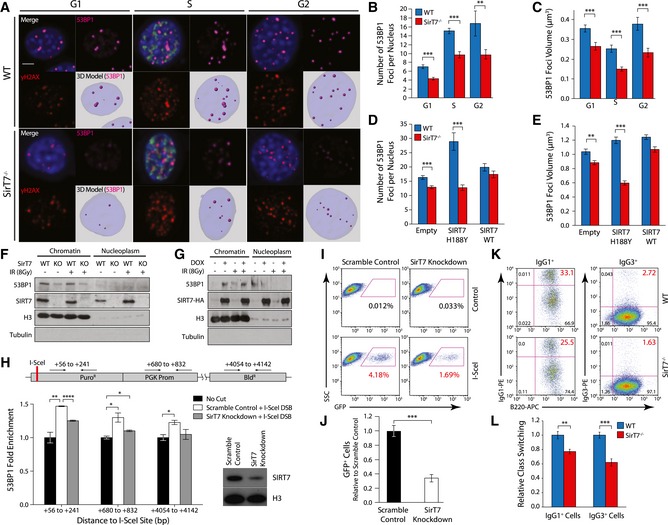
IF analysis of WT and SirT7
−/− primary fibroblasts after IR (1 Gy) and 1‐h chase. Cells were pulsed with EdU 30 min prior to fixation, stained with antibodies against γH2AX and 53BP1, and then counterstained with DAPI (scale bar 5 μm). (A) Representative images from each cell cycle stage showing merge (top left) including EdU (green), 53BP1 (top right, magenta), γH2AX (bottom left, red), and 3D rendering of reconstructed Z‐stacks with 53BP1 foci modeled as spheres (bottom right; pale blue: nucleus; magenta spheres: 53BP1 foci). (B) Quantitation of the number of 53BP1 foci per nucleus, and (C) mean volume of 53BP1 foci (n > 30 cells per group/mice; 3 mice per genotype; mean ± SEM). (D, E) Same as in (B, C), upon overexpression of SIRT7 WT or catalytically inactive point mutant SIRT7‐H188Y in WT and SirT7
−/− primary fibroblasts.
-
F
Detection of endogenous chromatin‐bound and nucleoplasmic 53BP1 protein from WT and SirT7
−/−
MEFs before and after IR (8 Gy) by Western blot. Histone H3 was used as loading control and tubulin as control for fractionation.
-
G
Same as F, using 293T‐REX cells treated with doxycycline or vehicle to induce SIRT7‐HA expression.
-
H
ChIP‐on‐break assay. (Top) Schematic of I‐SceI substrate construct introduced into HT1080 cells, which contains a single I‐SceI site located within a puromycin resistance cassette. Shown along the top are the coordinates for amplicons probed by Q‐PCR. (Bottom) 53BP1 enrichment at the indicated loci in scramble control or SirT7‐knockdown cells. Q‐PCR measurements were normalized to input DNA and non‐I‐SceI‐treated samples (no cut) (mean ± SEM; one of two independent experiments shown). (bottom right) Western blot demonstrating efficient knockdown of SirT7, with histone H3 as a loading control.
-
I, J
NHEJ repair assay using GFP expression‐based reporter system in SirT7‐depleted HT1080 cells (SirT7 knockdown) versus control (scramble control). (I) Representative FACS dot plots. (J) Quantitation of (I); mean ± SEM of three independent clones per condition. Values are normalized to control (scramble control + I‐SceI) mean.
-
K, L
Class‐switch recombination in splenic B cells from WT and SirT7
−/− mice stimulated with lipopolysaccharides (LPS) and interleukin‐4 (IL‐4). (K) The switching from IgM to IgG1 (left) and to IgG3 (right) was measured by FACS. (L) Quantitation of (K) showing mean ± SEM of 3–4 samples per genotype. One representative experiment from two is shown.
0.001 by ANOVA single factor.