
Figure 4.
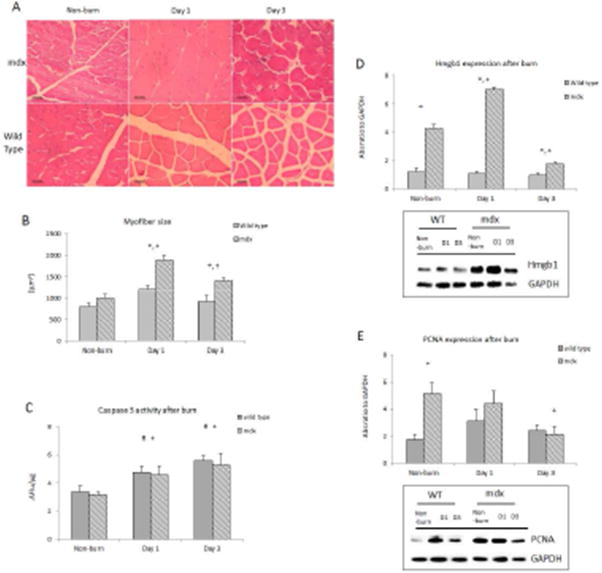
Muscle histology and cellular homeostasis in response burn. A) Cross sectional tissue slide of mouse gastrocnemius stained with hematoxylin and eosin; B) Myofiber size; C) Caspase-3 activity alterations in both groups after burn; D) HMGB1 western protein expression; E) PCNA protein expression. * p<0.05 mdx vs. wild type; + p<0.05 mdx mice vs. non-burn group; # p<0.05 wild type vs. non-burn group (n=6/group)