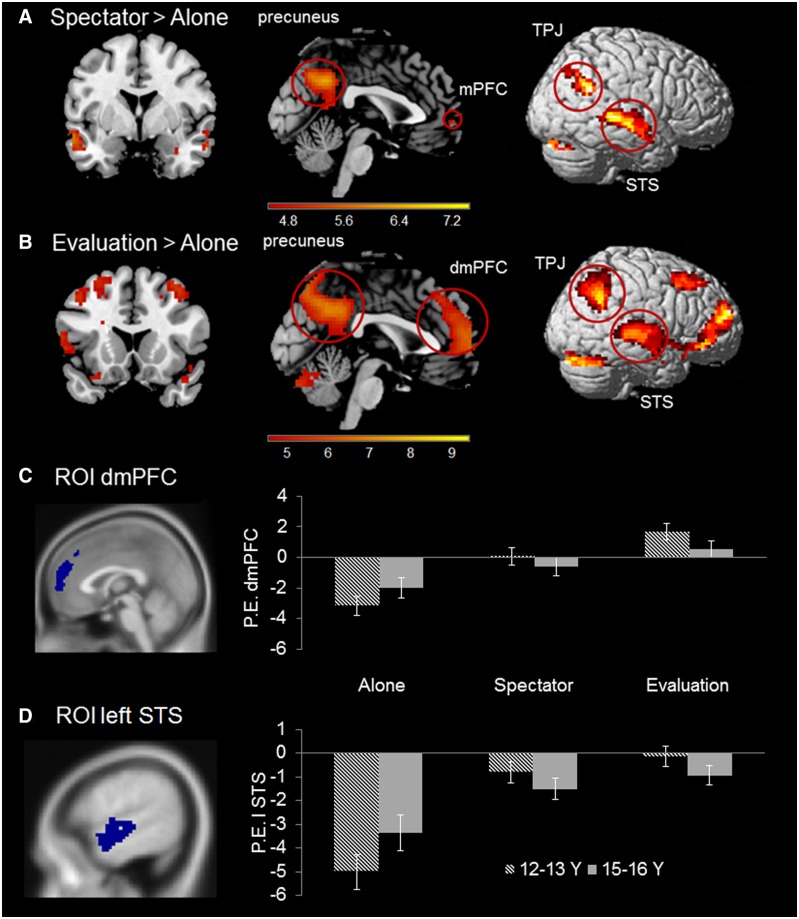
Figure 3.
(A) Areas identified in the contrast Spectator > Alone at stimulus onset. (B) Areas identified in the contrast Evaluation > Alone at stimulus onset. Evaluation > Spectator yielded no significant findings at stimulus onset. All contrasts are FWE-corrected, P < 0.05. (C and D) Graphs illustrate two follow-up ROI analyses performed on dmPFC (MNI: 0 52 19) and left STS (MNI: −60 −12 3) extracted from the main effect of Condition. Both regions show a Condition × Age group interaction, see text for explanation. Striped bars indicate means for 12–13 year olds and grey bars indicate means for 15–16 year olds. Error bars represent standard error of the mean.

