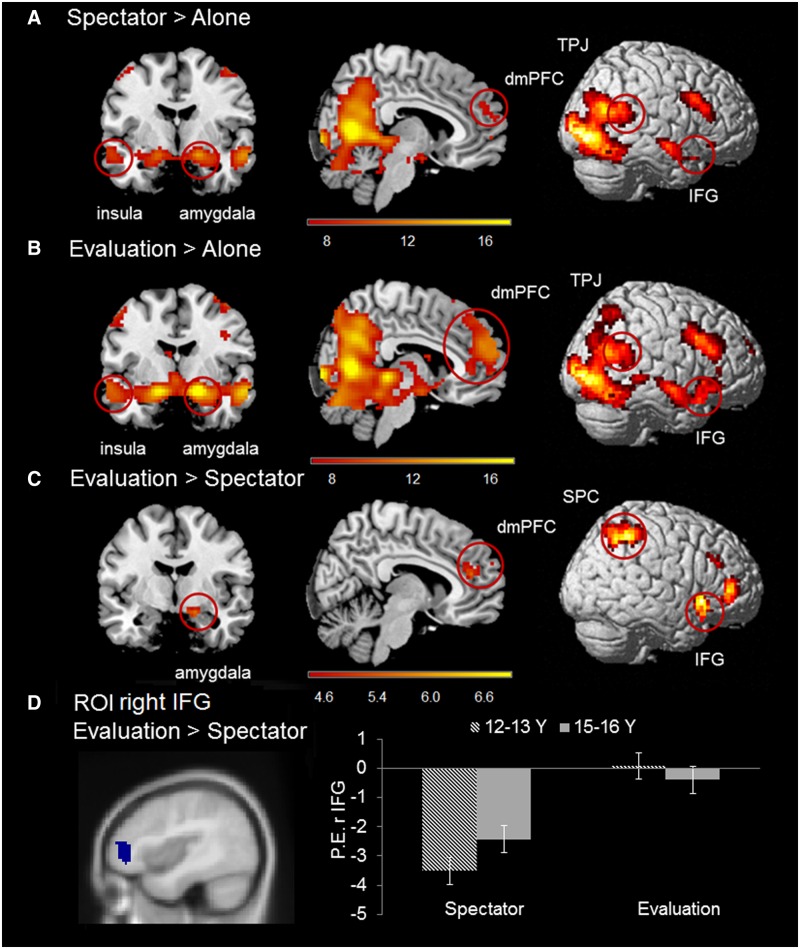
Figure 5.
(A) Areas identified in contrast Spectator > Alone at feedback onset. (B) Areas identified in contrast Evaluation > Alone at feedback onset. (C) Areas identified in contrast Evaluation > Spectator at feedback onset. All contrasts are FWE-corrected, P < 0.05. (D) Graph illustrates follow-up ROI analysis performed on right IFG (MNI: 42 45 3) extracted from contrast Evaluation > Spectator. The STS region showed a Condition × Age Group interaction, see text for explanation. Striped bars indicate means for 12–13 year olds and grey bars indicate means for 15–16-year olds. Error bars represent standard error of the mean.

