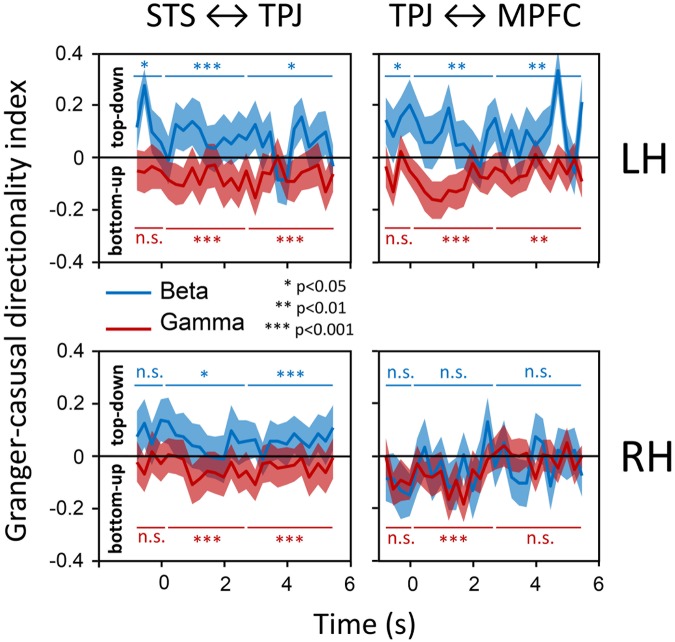
Fig. 2.
GC influences of gamma and beta-band connectivity. The index of the net GC directionality (GC-index) is shown as a function of time (t = 0 s denotes trial onset) for connections between STS and TPJ (left panels), and for the connections between TPJ and MPFC (right-hand panels), for the left (upper panels) and right (lower panels) hemisphere separately. Blue lines depict group-level averaged beta-band directionalities (±s.d.), red lines the directionality in the gamma-band. The individual-subject GC-index is defined as (GC top-down − GC bottom-up)/(GC top-down + GC bottom-up). Horizontal blue and red lines above and below the data traces indicate the baseline, kinematics and outcome epochs within the trial, over which the statistics are computed. Per subject, data are averaged over all trials. LH, left hemisphere; RH, right hemisphere; n.s., not significant.

