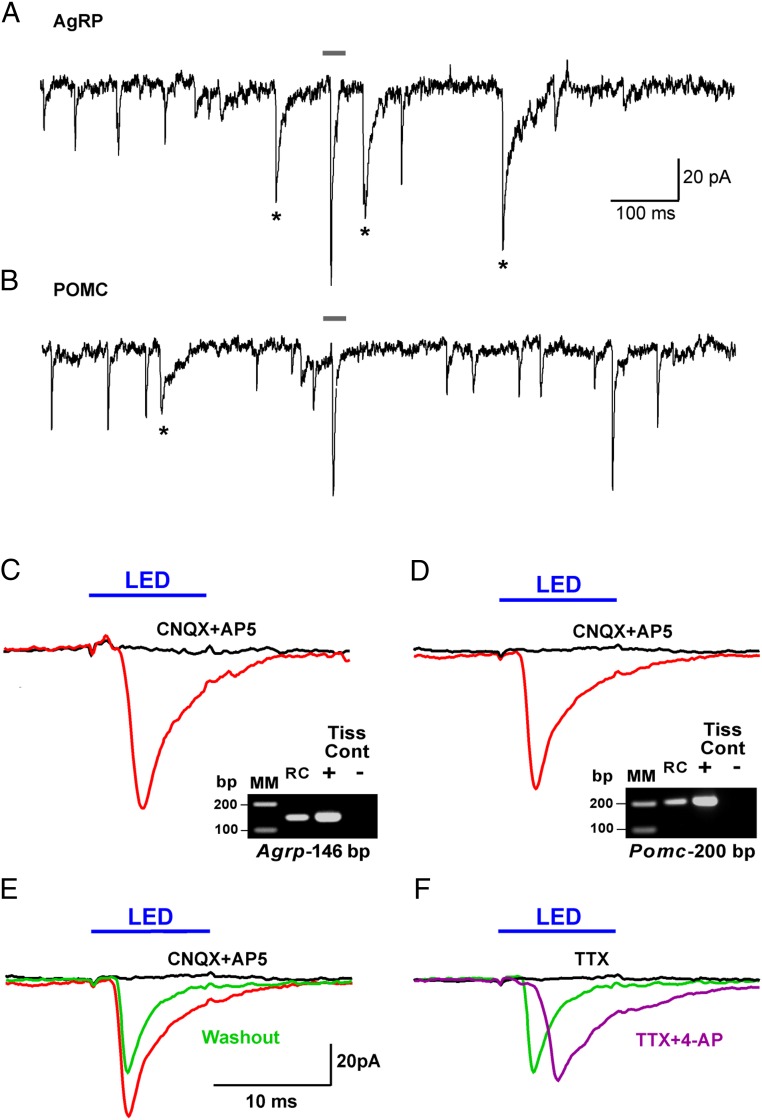
Figure 6.
Photo-stimulation of glutamate, not GABA, release from Kiss1ARC neurons onto AgRP and POMC neurons. Whole-cell, voltage-clamp recording (Vh = −60 mV) using high chloride internal solution from an AgRP neuron (A) and a POMC neuron (B) near Kiss-ChR2:YFP fibers. Based on the decay time constant (13.1 ± 1.8 ms), GABA PSCs are noted with an asterisk. Averaged traces for photo-stimulation (intensity, 660 μW; duration, 10 ms) of ARC Kiss1-ChR2:YFP neurons while recording (high chloride internal solution) from an AgRP neuron (C) and a POMC neuron (D) before (red trace) and after (black trace) CNQX (10μM) and AP5 (50μM) application. E, Photo-stimulation after the washout (green trace) of CNQX and AP5 from (D). F, Photo-stimulation in the presence of TTX (black trace; 1μM) followed by photo-stimulation with addition of 4-AP (purple trace; 100μM). The average of recordings for each experiment is displayed as a trace line with color (red, black, green, or purple). Cells were identified post hoc using scRT-PCR. RC, recorded cell. Gray bar above recordings in A and B correspond to recordings in C and D. Blue bar above recordings indicate LED stimulus (C–F). Scale in E also applies to C–F.

