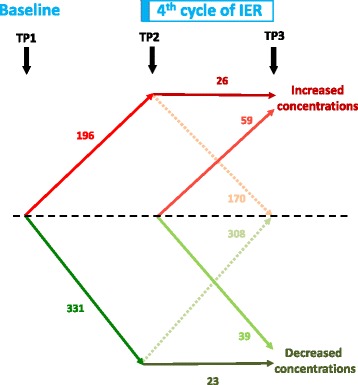
Fig. 2.

Significantly changed identified metabolites between baseline (time point 1 (TP1)) and during the fourth or fifth cycle of intermittent energy restriction (IER), after two days of 65 % energy restriction (TP2) and after 5 days of normal eating (TP3). Many metabolites were not significantly different from baseline at TP3 although some remained elevated. Some metabolites only increased or decreased during the five-day normal diet period between TP2 and TP3
