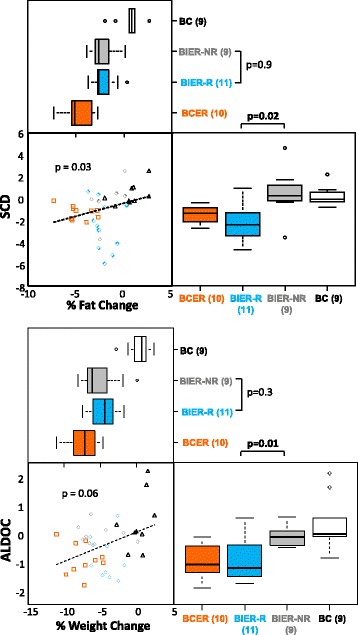
Fig. 4.

Changes in weight and body fat are correlated with transcriptional markers of energy restriction in breast tissue, but only half of the participants on intermittent energy restriction (IER) have expected molecular changes. Examples demonstrating that IER induces more subtle and variable changes than continuous energy restriction (CER) in breast tissue, both in terms of fat and weight percentage changes and changes in transcription of stearoyl-CoA desaturase (SCD) (fat synthesis) and aldolase C, fructose-bisphosphate (ALDOC) (glycolysis). Transcriptional changes similar to those seen with CER are limited to the IER responders (R, blue, diamonds), rather than non-responders (NR, grey, diamonds) identified in Fig. 2. BIER breast intermittent energy restriction, BCER breast continuous energy restriction (orange, squares), BC breast non-dieting controls (white, black triangles). For correlation the p values are for Spearman’s correlation analysis and group-wise p values are for the Wilcoxon test
