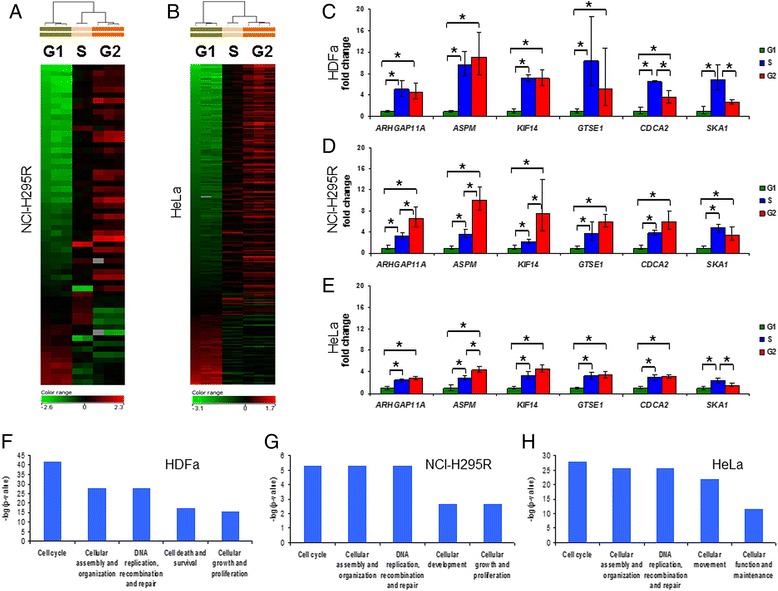
Fig. 2.

High throughput gene expression profiling, qRT-PCR validation and functional bioinformatics analysis of cell cycle dependent transcription in HDFa, NCI-H295R and HeLa cells. Panels a-b: Heat map of mRNA transcripts with significantly different expression between cell cycle phases (Panel a: NCI-H295R, Panel b: HeLa). Above the heat maps, hierarchical clustering upon differently expressed genes are also shown (additional information, including the list of gene symbols and descriptions can be found in Additional file 1: Table S3, panels B and C). Panels c-e: qRT-PCR validation of six genes chosen upon microarray analysis (Panel c: HDFa, Panel d: NCI-H295R, Panel e: HeLa). In each case ΔCt value was normalized to G1 phase (ΔΔCt) and was subjected to FC = 2-ΔΔCt transformation. Error bars show standard deviation. Asterisks mark statistical significance (p < 0.05). Panels f-h: Molecular and cellular functions concerned by gene expression alterations in cell cycle phases. Δ(G2-G1) gene expression changes of significantly differently expressed genes (Panel g: NCI-H295R, Panel h: HeLa) or genes with fold change > 2 expression (Panel f: HDFa) were subjected to IPA core analysis. In each cell, the five most significantly concerned networks are shown. Significance threshold (p = 0.05) corresponds to –log(p-value) = 1.301. For additional molecular and cellular functions see Additional file 2: Figure S2
