Fig. 4.

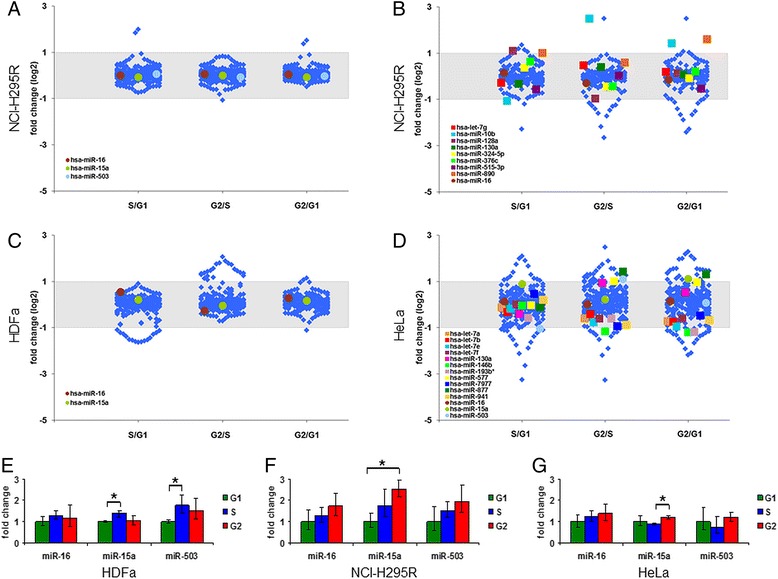
Analysis of cell cycle dependent miRNA expression by high-throughput screenings methods and individual qRT-PCR in HDFa, NCI-H295R and HeLa cells. Panels a-d: Fold change (log2) of miRNA expression in S/G1, G2/S and G2/G1 phases observed by microarray (Panel a: NCI-H295R cells, Panel c: HDFa cells), TaqMan Low Density Array (Panel b: NCI-H295R cells) and Illumina Small RNA Sequencing (Panel d: HeLa cells). Grey background corresponds to fold change ≤ 2 between cell cycle phases. Colored squares represent miRNAs with significantly different expression in cell cycle phases obtained by statistical analysis of high-throughput data. Colored circles represent some members of the hsa-miR-16 family, if available. For further high-throughput data of NCI-H295R cells (Illumina Small RNA Sequencing) see Additional 2: Figure S5. For qRT-PCR measurement data see Additional 2: Figure S6. Panels e-g: QRT-PCR measurements of hsa-miR-16 family members hsa-miR-16, hsa-miR-15a and hsa-miR-503 in HDFa (Panel e), NCI-H295R (Panel f) and HeLa (Panel g) cells. In each case ΔCt values were normalized to G1 phase (ΔΔCt) and were subjected to FC = 2-ΔΔCt transformation. Error bars show standard deviation. Asterisks mark statistical significance (p < 0.05)
