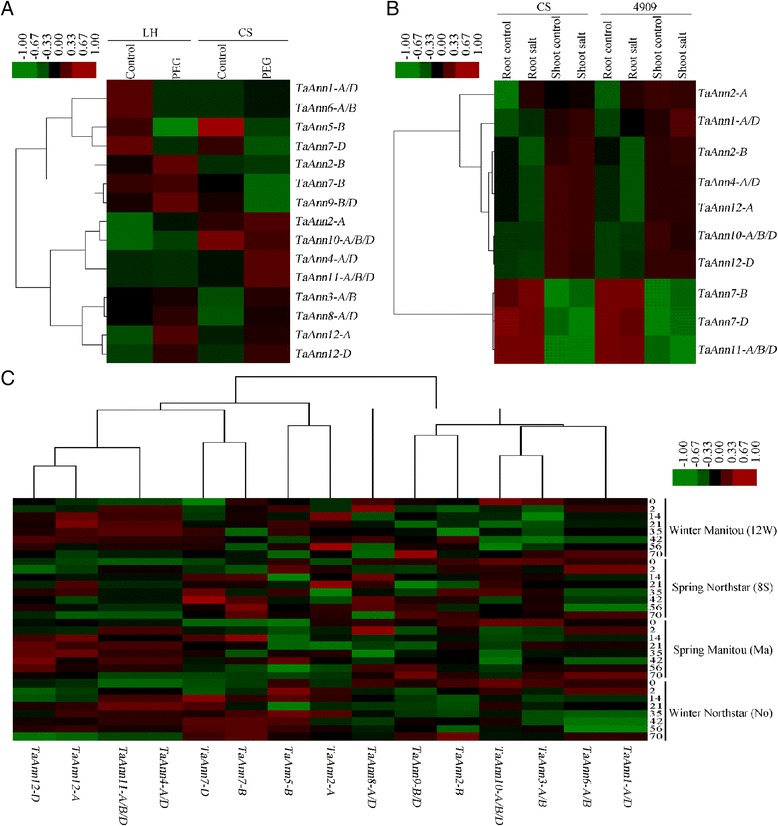
Fig. 4.

Expression patterns of 15 TaAnn genes under drought, salt and cold conditions. Heat maps were made based on the published microarray data to represent expression patterns. a The heat map for expression patterns under drought condition. Expression data were obtained from TA43 (GSE30872) experiment. The plant materials used are roots of Luohan (LH) and Chinese Spring (CS) seedlings. b The heat map for expression patterns under salt condition. Expression data were obtained from E-MEXP-971 experiment. Roots and shoots of a highly salt-tolerant wheat line 4909 and a salt-sensitive line CS were used. c The heat map for expression patterns under cold treatment. Expression data were got from TA42 (GSE23889) experiment
