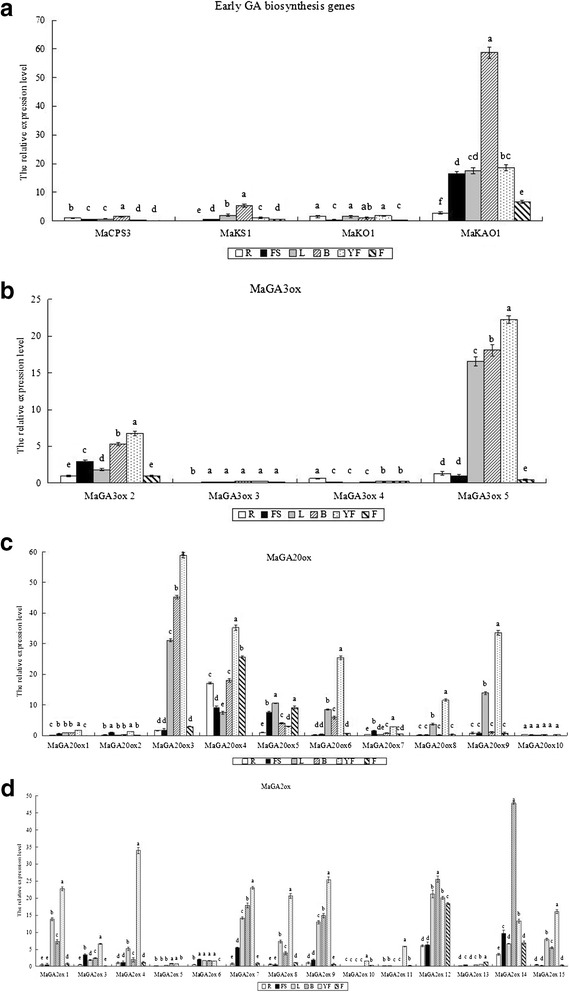
Fig. 4.

Tissue-specific expression of the GA metabolism genes in various tissues of banana dwarf mutant 8818-1. Total RNAs were isolated from leaves (L), bracts (B), false stems (FS), roots (R), young fruits (YF), and approximately mature fruits (F) in growth and development period, and qRT-PCR was conducted. Relative expression value was calculated using ‘actin’ as a reference by 2-ΔΔCt method. Expression level of MaCPS3, MaGA3ox2, MaGA20ox5 and MaGA2ox4 in the root were respectively defined as 1 in a, b, c and d. Fold change of the target gene in every tissue, normalized to actin and relative to the expression of MaCPS3, MaGA3ox2, MaGA20ox5, MaGA2ox4 in the root respectively in a, b, c and d, was calculated for each sample using the 2-ΔΔCt method. The CT value of each gene was the average of three technical replicates with the standard error indicated. Significant difference of relative expression value in different tissues of the same target gene estimated by Duncan’s test was reported on the graphics (p-value < 0.05). Means labeled by the same letter are not significantly different
