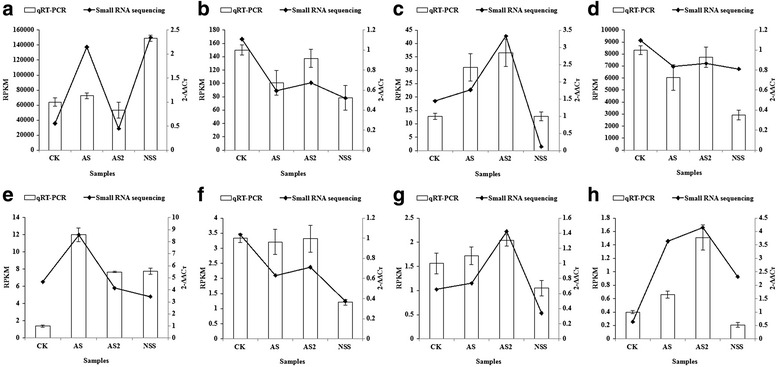
Fig. 3.

Comparison of the miRNA expression profiles determined by quantitative real-time RT-PCR (qRT-PCR) and deep sequencing. Bars represent the standard deviations of three replicates. a lus-miR156b; b lus-miR159c; c lus-miR160a; d lus-miR168a; e lus-miR169a; f lus-miR319a; g lus-miR393a; h lus-miR398a
