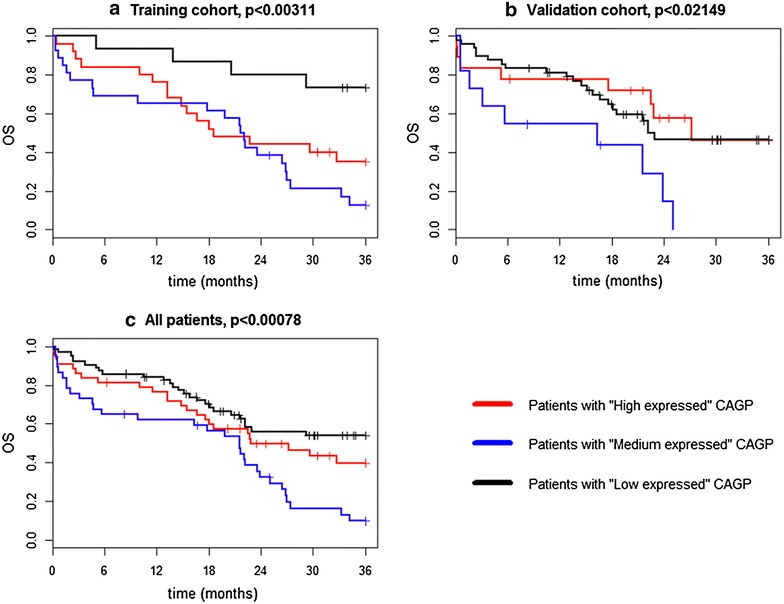
Fig. 1.

Overall survival of three CAGP expression groups of MM patients. a Kaplan–Meier curves for OS of training patients’ cohort (n = 73) stratified by centrosome associated gene pattern (CAGP). b Kaplan–Meier curves for OS of validation patients’ cohort (n = 78) stratified by centrosome associated gene pattern (CAGP). c Kaplan–Meier curves for OS of jointed training and validation patients’ cohort (n = 151) stratified by centrosome associated gene pattern (CAGP)
