Fig. 2.

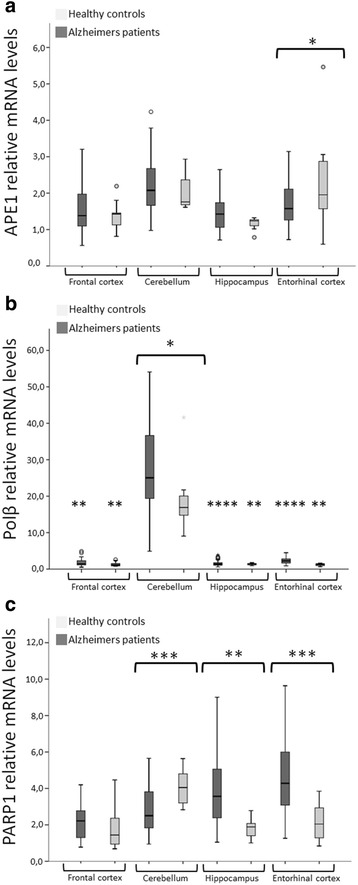
APE1 and Polβ mRNA levels in brain parts from AD patients and healthy controls (HC) (mean ± 2 SEM), p-values: * < 0.05, ** < 0.01, *** < 0.001, **** < 0.0001. a The box plot shows that mRNA levels of APE1 are significantly lower (p <0.05) in entorhinal cortex of AD patients compared to HC. b The box plot shows that mRNA levels of Polβ are significantly higher (p <0.05) in cerebellum of AD patients compared to HC. Polβ mRNA is also significantly higher in the cerebellum compared to all other brain parts in both HC and AD patients. c The box plot shows that PARP1 mRNA levels were significantly lower in AD cerebellum (p < 0.0005) compared to HC cerebellum and significantly higher in AD hippocampus (p < 0.005) and entorhinal cortex (p < 0.0001) compared to the same regions in HC. OGG1 mRNA levels did not differ between AD and HC brain regions
