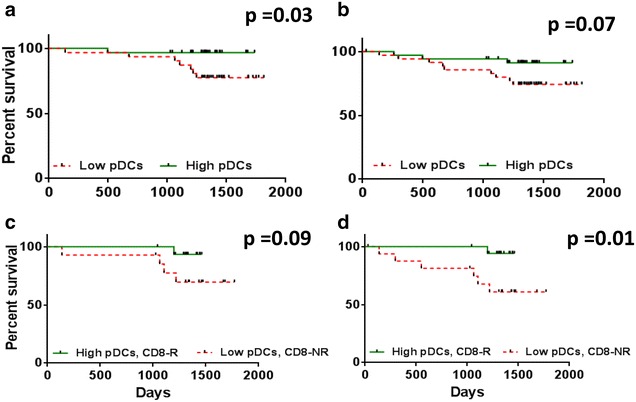
Fig. 2.

Kaplan–Meier survival analysis of non-metastatic (left) and all (right) patients according to the level of pDCs and for patients according to CD8+ T-cell response to Her-2 and level of DC subsets. Analysis of non-metastatic (a) and all patients (b) with low (≤median) versus high (>median) levels of DCs. Patients with CD8+ T-cell responses to Her-2 and high levels of pDCs compared to low levels of pDCs with no CD8+ T-cell response to Her-2, in c non-metastatic and d all patients
