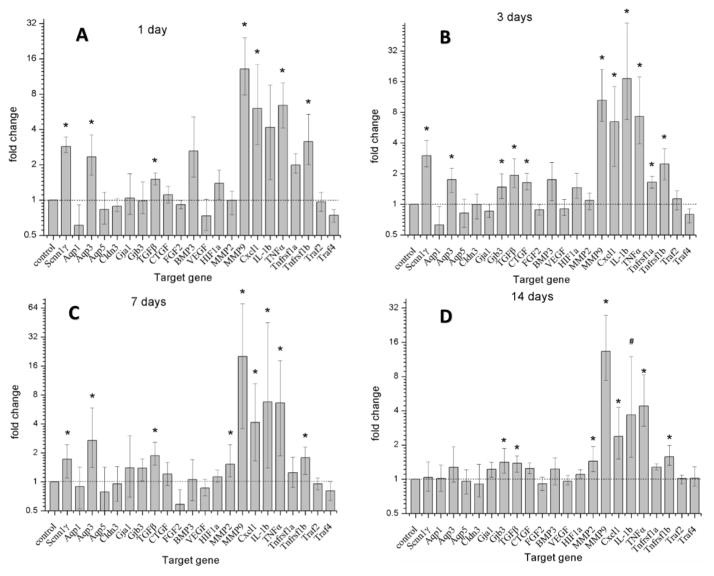
Figure 2.
Changes in target gene expression following cochlear implantation as compared to non-surgery control ears. Error bars depict SEM. Asterisks indicate statistically significant values as compared to control ears. The gene expression changes are ordered as follows: housekeeping gene (column 1), ion homeostasis genes (columns 2–8), tissue remodeling genes (columns 9–16), and inflammation-related genes (columns 17–23).

