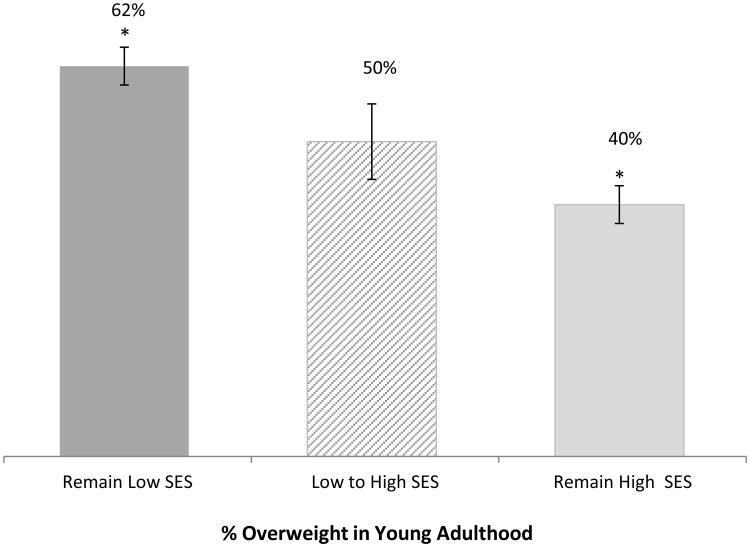
Figure 2. Adjusted prevalence of overweight among young adults (EAT-III; 2009) across three key family-level socioeconomic status (SES) and educational attainment categories.
Remain Low SES=young adults from a low socioeconomic background with no more than high school education; Low to High SES = young adults from a low socioeconomic background who completed a Bachelor or professional degree; and Remain High SES=young adults from the highest socioeconomic background and who completed a Bachelor or professional degree. * indicates a statistically significant difference between groups, p<.001. Young adult participants of Project EAT recruited from schools in Minneapolis/St. Paul, MN, USA at baseline.

