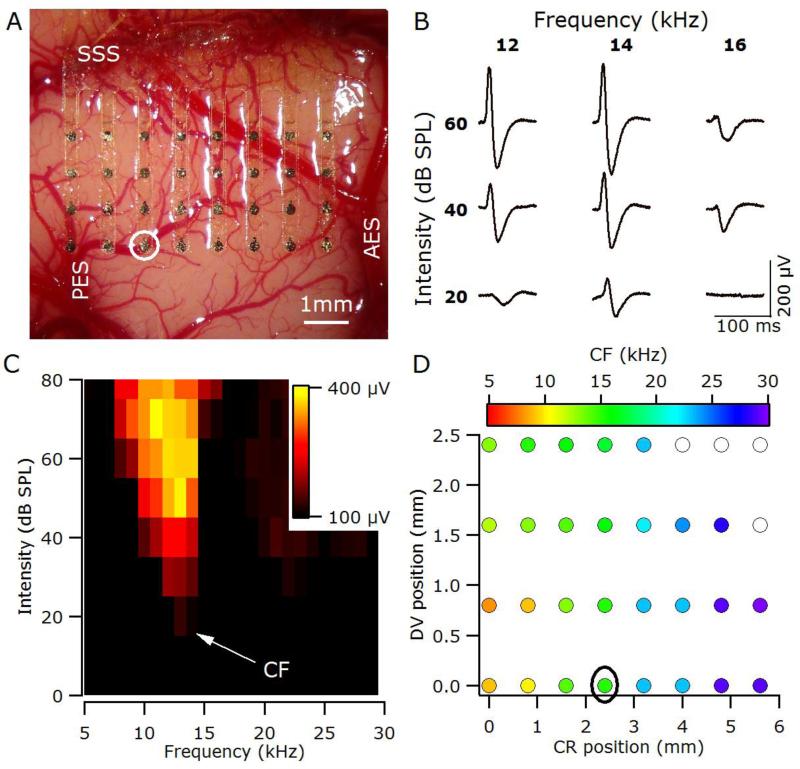
Figure 2.
(A) The thin-film recording array covers the majority of the right primary auditory cortex in a normal-hearing animal (6_19). SSS, suprasylvian sulcus; AES, anterior ectosylvian sulcus; PES, posterior ectosylvian sulcus. (B) Sample local field potentials (LFPs) recorded from the location circled in A & D. LFPs are the averaged response to 10 stimuli, with the first 100 ms of the response shown. (C) Response area, plots the peak-to-peak amplitude of the LFP (yellow-maximum, black minimum) for the recording site circled in A & D. The CF for this site was 14 kHz. (D) Tonotopic organisation of auditory cortex determined using analysis of response areas based on LFPs. Filled symbols represent the characteristic frequency (CF) at each recording site. Open symbols indicate recordings sites for which it was not possible to determine a CF; CR, caudal-rostral position relative to electrode closest to the tip of PES; DV, dorsalventral position relative to electrode closest to the tip of PES.

