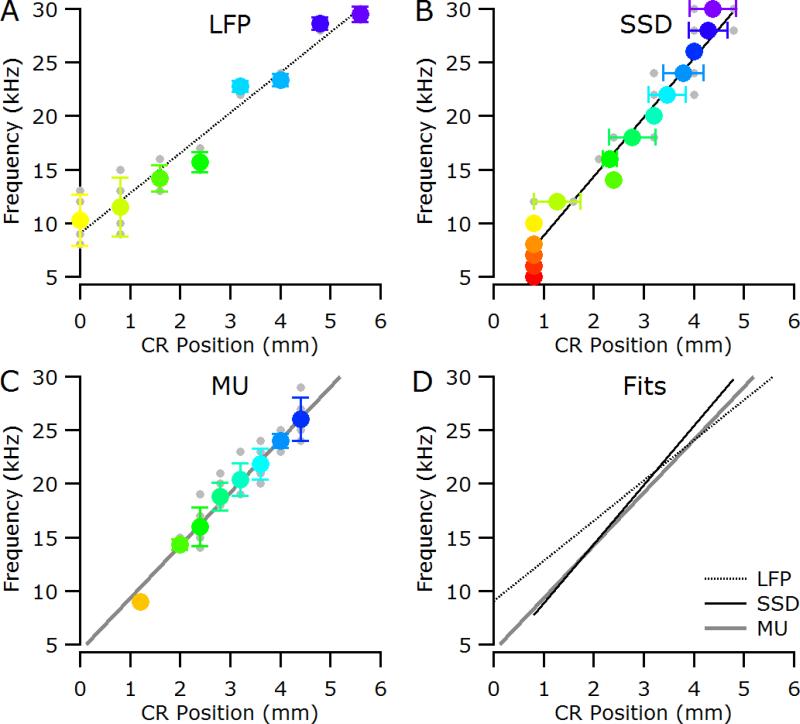
Figure 4.
Data from a normal-hearing cat (6_19). (A) Characteristic frequency (CF) as determined from the LFP response areas plotted against caudal-rostral position. (B) Location of the negative maximum in the SSD analysis for a given stimulus frequency. (C) CF as determined from the multi-unit (MU) activity plotted against caudal-rostral position. In all panels, individual data points are shown in grey; colored symbols are mean (± standard deviation). Lines represent fits to the caudal-rostral shift with increasing stimulus frequency. (D) Overlay of the linear fits for LFP, SSD and MU analysis. CR, caudal-rostral position relative to electrode closest to the tip of the posterior ectosylvian sulcus.

