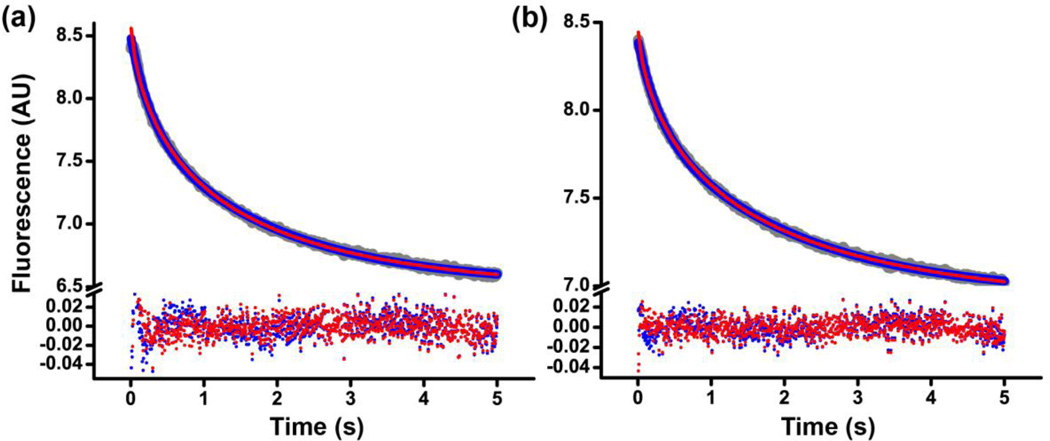
Figure 5.
Comparison of double-exponential and stretched exponential fits of kinetics of mRNA translocation induced by EF-G•GTP (a) or EF-G•GDP•BeF3− (b). Fluorescein quenching is shown in grey, double-exponential and stretched exponential fits in blue and red, respectively. The corresponding residuals obtained by subtracting the fitted curves from the raw data are shown at the bottom. The reduced chi-squared and the coefficient of determination R2 for both double-exponential and stretched exponentials fits in (a) were 2*10−4 and 0.999, respectively; in (b) − 1*10−4 and 0.999, respectively. Experiments were performed in polyamine buffer at pH 7.5.

