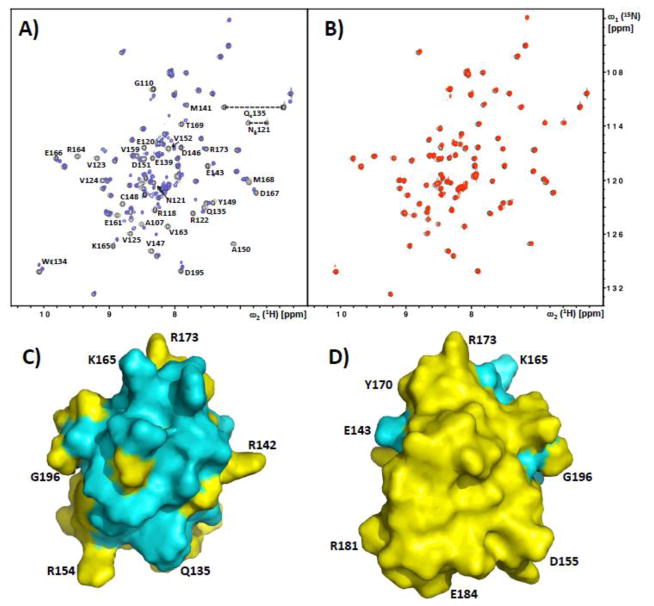
Figure 2. NMR observation of intermolecular complex formation between SRSF1-RRM2 and the solubilized SRSF1-RS domain.
A) Superposition of the [15N,1H]-HSQC spectra of 15N-labeled SRSF1-RRM2 with (red) and without (black) addition of 1.2 equivalents of GST-RS1. Residues of SRSF1-RRM2 experiencing chemical shifts and/or line broadening upon binding of GST-RS1 are indicated. B) Superposition of the [15N,1H]-HSQC spectra of 15N-labeled SRSF1-RRM2 with (red) and without (black) addition of 1.2 equivalents of phosphorylated GST-RS1. There are no detectable chemical shift perturbations; This spectrum also documents the high purity/homogeneity of the protein preparation. C,D) Front and back surface views of SRSF1-RRM2, with residues affected by the presence of GST-RS1 (see panel A) colored cyan. Some amino acid positions are indicated to guide the eye.

