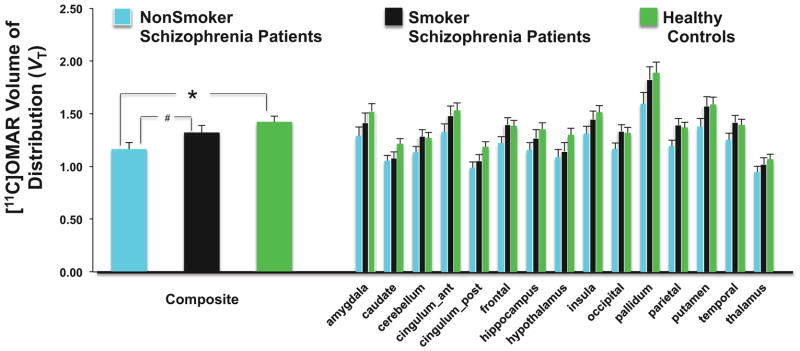
Figure 1. Grand Averaged CB1R availability in Schizophrenia Patients vs. Healthy Controls.
Top row: HC averaged (n=21) of the distribution volume (VT; Innis et al., 2007) images computed using the multilinear analysis (MA1; Ichise et al., 2002)
Middle row: SCZ averaged (n=25) of the distribution volume (VT; Innis et al., 2007) images computed using the multilinear analysis (MA1; Ichise et al., 2002)
Bottom row: Aligned T1 MR image for anatomical reference

