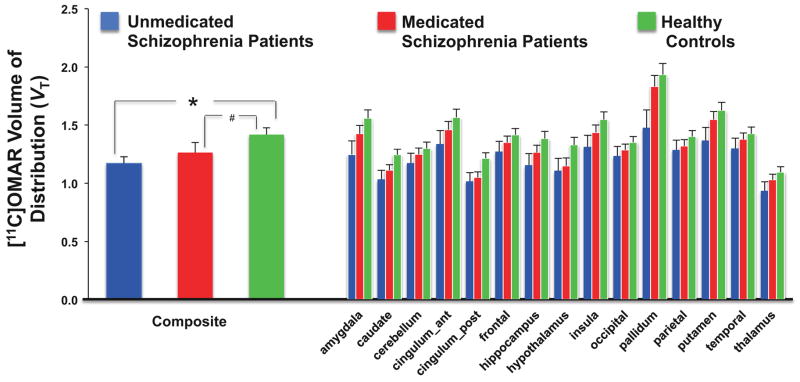
Figure 2. CB1R availability in Schizophrenia Patients vs. Healthy Controls.
The figure shows the mean and standard error bars of [11C]OMAR Volume of Distribution (VT).
Significant differences (p<0.05) between groups are indicated with *.
Trend differences (p<0.06–0.1) between groups are indicated with #.

