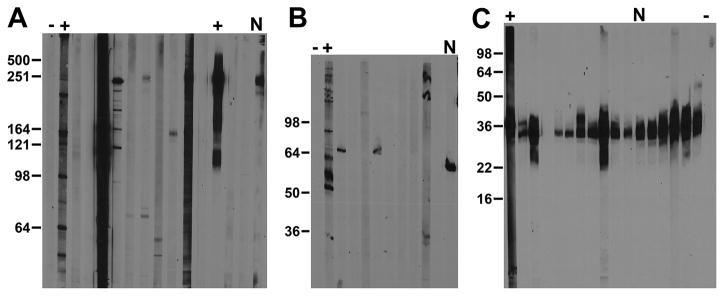
Figure 2. Representative immunoblot secondary screen data.
Images show immunoblot data from three different NeuroMab projects. (A) Anti-pan Nav1 channel N419 NeuroMab project. (B) Anti-GABA(A) receptor π subunit N431 NeuroMab project. (C) Anti-KChIP4 N423 NeuroMab project. Numbers to the left of each panel show the mobility of molecular weight standards in kDa. Adult rat brain protein samples analyzed were a P2 crude membrane fraction or RBM (A and C) or a P1 low-speed pellet or RBLSP (B). Expected relative electrophoretic mobilities for target bands were 250 kDa (A), 50 kDa (B), and 30 kDa (C). The subset of strips shown depicts multiple candidates. (A) N419/28 to N419/40. (B) N431/55 to N431/64. (C) N423/28 to N423/37. Each set includes respective positive and negative controls (plus and minus symbols, respectively). The “N” denotes candidates that ultimately became a NeuroMab. (A) N419/40. (B) N431/64. (C) N423/75.

